Dried blood spots as a source of anti-malarial antibodies for epidemiological studies - PubMed (original) (raw)
Comparative Study
doi: 10.1186/1475-2875-7-195.
Jackie Cook, Caroline Lynch, Heleen Leendertse, Alphaxard Manjurano, Jamie Griffin, Jonathan Cox, Tarekegn Abeku, Teun Bousema, Azra C Ghani, Chris Drakeley, Eleanor Riley
Affiliations
- PMID: 18826573
- PMCID: PMC2567984
- DOI: 10.1186/1475-2875-7-195
Comparative Study
Dried blood spots as a source of anti-malarial antibodies for epidemiological studies
Patrick H Corran et al. Malar J. 2008.
Abstract
Background: Blood spots collected onto filter paper are an established and convenient source of antibodies for serological diagnosis and epidemiological surveys. Although recommendations for the storage and analysis of small molecule analytes in blood spots exist, there are no published systematic studies of the stability of antibodies under different storage conditions.
Methods: Blood spots, on filter paper or glass fibre mats and containing malaria-endemic plasma, were desiccated and stored at various temperatures for different times. Eluates of these spots were assayed for antibodies against two Plasmodium falciparum antigens, MSP-119 and MSP2, and calculated titres used to fit an exponential (first order kinetic) decay model. The first order rate constants (k) for each spot storage temperature were used to fit an Arrhenius equation, in order to estimate the thermal and temporal stability of antibodies in dried blood spots. The utility of blood spots for serological assays was confirmed by comparing antibodies eluted from blood spots with the equivalent plasma values in a series of samples from North Eastern Tanzania and by using blood spot-derived antibodies to estimate malaria transmission intensity in this site and for two localities in Uganda.
Results: Antibodies in spots on filter paper and glass fibre paper had similar stabilities but blood was more easily absorbed onto filter papers than glass fibre, spots were more regular and spot size was more closely correlated with blood volume for filter paper spots. Desiccated spots could be stored at or below 4 degrees C for extended periods, but were stable for only very limited periods at ambient temperature. When desiccated, recoveries of antibodies that are predominantly of IgG1 or IgG3 subclasses were similar. Recoveries of antibodies from paired samples of serum and of blood spots from Tanzania which had been suitably stored showed similar recoveries of antibodies, but spots which had been stored for extended periods at ambient humidity and temperature showed severe loss of recoveries. Estimates of malaria transmission intensity obtained from serum and from blood spots were similar, and values obtained using blood spots agreed well with entomologically determined values.
Conclusion: This study has demonstrated the suitability of filter paper blood spots paper for collection of serum antibodies, and provided clear guidelines for the treatment and storage of filter papers which emphasize the importance of desiccation and minimisation of time spent at ambient temperatures. A recommended protocol for collecting, storing and assaying blood spots is provided.
Figures
Figure 1
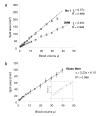
Correlation between blood volume and blood spot area. Increasing volumes (1 μl – 45 μl) of fresh heparinized blood were pipetted (five replicates per volume) onto Whatman 3 MM, Whatman No 1 or glass fibre filter paper, dried at ambient temperature and RH and optically scanned. Spot areas were measured by integration and plotted against the volume of blood applied. a) The relationship between volume and blood spot is linear over the entire range. A 2.5 mm diameter spot represents 0.77 μl and 1.4 μl of blood for No 1 paper and 3 MM paper respectively. Whatman No 1 filter paper (- -□- -) and Whatman 3 MM filter paper (.....○.......). b) Glass fibre paper. For blood volumes above 10 μl, spot size is linearly related to blood volume with a 2.5 mm diameter spot representing a volume of 2.2 μl of blood. For blood volumes below 10 μl (inset) the relationship between spot size and volume is unreliable.
Figure 2
Blood spot quality. Fifteen μl of fresh blood were spotted onto glass fibre filter paper (top), Whatman 3 MM paper (middle) and Whatman No 1 (bottom) and scanned on both sides. For each paper, the first row of images represents the side of the paper to which blood was applied; the lower image on the extreme right hand is the obverse view of the spot immediately above. For the glass fibre paper, a four-fold magnification of one of the spots is also shown.
Figure 3
Efficiency of recovery of antibodies from blood spots. Comparison of OD obtained from paired plasma and blood spot eluates (each at an equivalent of 1:000 dilution) where blood spots were stored for 2 days (a,c) or 2 weeks at ambient temperature and RH (b,d). Samples were assayed for antibodies to MSP-119 (a,b) and MSP-2 (c,d). Aliquots of 8 hyperimmune plasma samples were mixed with equal volumes of erythrocytes, spotted on 3 MM paper and dried overnight. The lines in a,c are the best fit least square straight lines, calculated recovery 99%. The dashed lines in c and d represent the least-squares best fit lines for the recoveries shown.
Figure 4
Kinetics of loss of antibodies at different storage temperatures. Blood spots were stored at + 23, 35, 47, 57 or 65°C for up to 130 days and then removed to -20°C until analysis. ODs were converted to antibody concentrations by reference to a standard curve. Lines represent the best-fit first order rate constants for each temperature.(a) MSP-119 antibodies. (b) MSP-2 antibodies.
Figure 5
Arrhenius plot of rates of loss of antibodies. Rate of loss of antibody titre at each temperature (k days-1, the fitted first order rate constant) versus the reciprocal of the absolute temperature in °K (1/T). • measured points; + extrapolated values for 10°C, 4°C and -20°C;. The weighted best fit straight line is shown together with the 95% confidence limits.
Figure 6
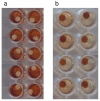
Appearance of fresh and degraded blood spots. Eluates from fresh blood spots (a) and spots stored for approximately 1 year at ambient temperature and humidity (b) are shown. In (a), complete elution of haemoglobin has resulted in a white filter paper disc in a red solution. In (b), little haemoglobin has been eluted so that the disc remains dark red and the solution pale.
Figure 7
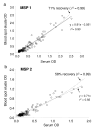
Recovery of antibodies from blood spots and plasma in field studies. Paired sets of serum and blood spots collected in Lower Moshi, Tanzania were collected and assayed for antibodies to MSP-119 (a) and MSP-2 (b). The straight lines represent the least squares best fit; the curved dashed lines represent the least squares best fit lines where the recovery has been allowed to vary, giving a mean recovery of 71% for MSP-119 and 58% for MSP-2.
Figure 8
Using blood spot eluates to estimate malaria transmission intensity in Uganda. Observed (•) and estimated (line) age-specific prevalence of antibodies to MSP-119 derived from blood spots obtained from parasite-negative individuals presenting at medical centres in (a) Rukungiri District (N= 1020 ; λ = 0.076; altitude 150–1,767 m) and (b) Kabale District (N= 958 ; λ = 0.009; altitude 1,948–2,420 m) Uganda.
Similar articles
- Immunophoretic rapid diagnostic tests as a source of immunoglobulins for estimating malaria sero-prevalence and transmission intensity.
Williams GS, Mweya C, Stewart L, Mtove G, Reyburn H, Cook J, Corran PH, Riley EM, Drakeley CJ. Williams GS, et al. Malar J. 2009 Jul 22;8:168. doi: 10.1186/1475-2875-8-168. Malar J. 2009. PMID: 19624812 Free PMC article. - Human saliva as a source of anti-malarial antibodies to examine population exposure to Plasmodium falciparum.
Estévez PT, Satoguina J, Nwakanma DC, West S, Conway DJ, Drakeley CJ. Estévez PT, et al. Malar J. 2011 Apr 29;10:104. doi: 10.1186/1475-2875-10-104. Malar J. 2011. PMID: 21527045 Free PMC article. - Acquisition of antibodies to merozoite surface protein 3 among residents of Korogwe, north eastern Tanzania.
Segeja MD, Mmbando BP, Seth MD, Lusingu JP, Lemnge MM. Segeja MD, et al. BMC Infect Dis. 2010 Mar 8;10:55. doi: 10.1186/1471-2334-10-55. BMC Infect Dis. 2010. PMID: 20205959 Free PMC article. - Serology: a robust indicator of malaria transmission intensity?
Corran P, Coleman P, Riley E, Drakeley C. Corran P, et al. Trends Parasitol. 2007 Dec;23(12):575-82. doi: 10.1016/j.pt.2007.08.023. Epub 2007 Nov 7. Trends Parasitol. 2007. PMID: 17988945 Review. - Use of filter paper for the collection and analysis of human whole blood specimens.
Mei JV, Alexander JR, Adam BW, Hannon WH. Mei JV, et al. J Nutr. 2001 May;131(5):1631S-6S. doi: 10.1093/jn/131.5.1631S. J Nutr. 2001. PMID: 11340130 Review.
Cited by
- Serological evidence of vector and parasite exposure in Southern Ghana: the dynamics of malaria transmission intensity.
Badu K, Gyan B, Appawu M, Mensah D, Dodoo D, Yan G, Drakeley C, Zhou G, Owusu-Dabo E, Koram KA. Badu K, et al. Parasit Vectors. 2015 Apr 28;8:251. doi: 10.1186/s13071-015-0861-y. Parasit Vectors. 2015. PMID: 25928847 Free PMC article. - The impact of hotspot-targeted interventions on malaria transmission: study protocol for a cluster-randomized controlled trial.
Bousema T, Stevenson J, Baidjoe A, Stresman G, Griffin JT, Kleinschmidt I, Remarque EJ, Vulule J, Bayoh N, Laserson K, Desai M, Sauerwein R, Drakeley C, Cox J. Bousema T, et al. Trials. 2013 Feb 2;14:36. doi: 10.1186/1745-6215-14-36. Trials. 2013. PMID: 23374910 Free PMC article. Clinical Trial. - Combined DNA extraction and antibody elution from filter papers for the assessment of malaria transmission intensity in epidemiological studies.
Baidjoe A, Stone W, Ploemen I, Shagari S, Grignard L, Osoti V, Makori E, Stevenson J, Kariuki S, Sutherland C, Sauerwein R, Cox J, Drakeley C, Bousema T. Baidjoe A, et al. Malar J. 2013 Aug 2;12:272. doi: 10.1186/1475-2875-12-272. Malar J. 2013. PMID: 23914905 Free PMC article. - Ecoimmunology in the field: Measuring multiple dimensions of immune function with minimally invasive, field-adapted techniques.
Blackwell AD, Garcia AR. Blackwell AD, et al. Am J Hum Biol. 2022 Nov;34(11):e23784. doi: 10.1002/ajhb.23784. Epub 2022 Jul 21. Am J Hum Biol. 2022. PMID: 35861267 Free PMC article. Review. - A seven-year study on the effect of the pre-erythrocytic malaria vaccine candidate RTS,S/AS01 E on blood stage immunity in young Kenyan children.
Ndungu FM, Mwacharo J, Wambua J, Njuguna P, Marsh K, Drakeley C, Bejon P. Ndungu FM, et al. Wellcome Open Res. 2019 Mar 5;4:42. doi: 10.12688/wellcomeopenres.15002.1. eCollection 2019. Wellcome Open Res. 2019. PMID: 31168483 Free PMC article.
References
- Enevold A, Vestergaard LS, Lusingu J, Drakeley CJ, Lemnge MM, Theander TG, Bygbjerg IC, Alifrangis M. Rapid screening for glucose-6-phosphate dehydrogenase deficiency and haemoglobin polymorphisms in Africa by a simple high-throughput SSOP-ELISA method. Malar J. 2005;4:61. doi: 10.1186/1475-2875-4-61. - DOI - PMC - PubMed
- Enevold A, Alifrangis M, Sanchez JJ, Carneiro I, Roper C, Borsting C, Lusingu J, Vestergaard LS, Lemnge MM, Morling N, Riley E, Drakeley CJ. Associations between alpha+-thalassemia and Plasmodium falciparum malarial infection in northeastern Tanzania. J Infect Dis. 2007;196:451–459. doi: 10.1086/519390. - DOI - PubMed
Publication types
MeSH terms
Substances
LinkOut - more resources
Full Text Sources
Other Literature Sources
Medical
Research Materials


