The histone H2B-specific ubiquitin ligase RNF20/hBRE1 acts as a putative tumor suppressor through selective regulation of gene expression - PubMed (original) (raw)
. 2008 Oct 1;22(19):2664-76.
doi: 10.1101/gad.1703008.
Itay Tirosh, Yael Aylon, Jing Huang, Chaoyang Ye, Neta Moskovits, Nina Raver-Shapira, Neri Minsky, Judith Pirngruber, Gabi Tarcic, Pavla Hublarova, Lilach Moyal, Mali Gana-Weisz, Yosef Shiloh, Yossef Yarden, Steven A Johnsen, Borivoj Vojtesek, Shelley L Berger, Moshe Oren
Affiliations
- PMID: 18832071
- PMCID: PMC2559905
- DOI: 10.1101/gad.1703008
The histone H2B-specific ubiquitin ligase RNF20/hBRE1 acts as a putative tumor suppressor through selective regulation of gene expression
Efrat Shema et al. Genes Dev. 2008.
Erratum in
- Corrigendum: The histone H2B-specific ubiquitin ligase RNF20/hBRE1 acts as a putative tumor suppressor through selective regulation of gene expression.
Shema E, Tirosh I, Aylon Y, Huang J, Ye C, Moskovits N, Raver-Shapira N, Minsky N, Pirngruber J, Tarcic G, Hublarova P, Moyal L, Gana-Weisz M, Shiloh Y, Yarden Y, Johnsen SA, Vojtesek B, Berger SL, Oren M. Shema E, et al. Genes Dev. 2017 Sep 15;31(18):1926. doi: 10.1101/gad.307207.117. Genes Dev. 2017. PMID: 29051390 Free PMC article. No abstract available.
Abstract
Histone monoubiquitylation is implicated in critical regulatory processes. We explored the roles of histone H2B ubiquitylation in human cells by reducing the expression of hBRE1/RNF20, the major H2B-specific E3 ubiquitin ligase. While H2B ubiquitylation is broadly associated with transcribed genes, only a subset of genes was transcriptionally affected by RNF20 depletion and abrogation of H2B ubiquitylation. Gene expression dependent on RNF20 includes histones H2A and H2B and the p53 tumor suppressor. In contrast, RNF20 suppresses the expression of several proto-oncogenes, which reside preferentially in closed chromatin and are modestly transcribed despite bearing marks usually associated with high transcription rates. Remarkably, RNF20 depletion augmented the transcriptional effects of epidermal growth factor (EGF), increased cell migration, and elicited transformation and tumorigenesis. Furthermore, frequent RNF20 promoter hypermethylation was observed in tumors. RNF20 may thus be a putative tumor suppressor, acting through selective regulation of a distinct subset of genes.
Figures
Figure 1.
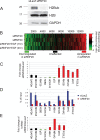
RNF20 depletion decreases H2B ubiquitylation and causes large-scale expression changes. (A) Western blot analysis of H2Bub and total H2B 48 h after transient transfection of HeLa cells with RNF20 siRNA (siRNF20) or LacZ siRNA (siLacZ). GAPDH served as loading control. (B) Expression microarray analysis of the impact of RNF20 knockdown. RNA was extracted from HeLa cells 48 h after transfection with either RNF20 siRNA or LacZ siRNA, with or without EGF treatment (20 ng/mL), and hybridized to Affymetrix HG-U133A oligonucleotide arrays (see Materials and Methods). Colors indicate the normalized log2 expression ratio (siRNF20/siLacZ, with or without EGF as indicated) for each gene. The two top rows represent two independent biological repeats. (Bottom) Colored horizontal bars indicate the three groups of genes (∼1000 each) selected for ChIP-Seq (Fig. 2A) and ChIP/chip (Fig. 2B). (C) qRT–PCR validation of selected genes from B. RNF20-dependent genes (down-regulated in siRNF20), unaffected genes, and genes suppressed by RNF20 (up-regulated in siRNF20) are in green, black, and red, respectively. The Y axis shows fold change in siRNF20 relative to siLacZ. Prior to fold change calculation, values were normalized to GAPDH mRNA in the same sample. The GAPDH bar indicates the ratio between the nonnormalized amounts of GAPDH mRNA in the siRNF20 and siLacZ samples, respectively. (D) ChIP analysis of relative H2Bub abundance on the genes indicated in C, in siLacZ (blue) and siRNF20 (red) HeLa cells. ChIP was done with anti-H2Bub antibodies (Minsky et al. 2008). Immunoprecipitated DNA and input DNA were quantified by qPCR with primers specific for the transcribed regions of the indicated genes. (E) qRT–PCR analysis of precursor RNA. The RNA samples in C were subjected to qRT–PCR analysis with primer pairs derived from intronic sequences of the indicated genes, to quantify nonspliced primary transcripts and splicing intermediates. The Y axis represents fold change in siRNF20 relative to siLacZ, normalized to mature GAPDH mRNA in the same sample.
Figure 2.
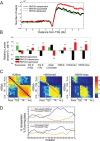
RNF20-suppressed genes are associated with higher levels of H2Bub, H3K3me3, and H3K9/14Ac, higher Pol II occupancy, and compact chromatin. (A) Pattern of H2Bub distribution in HeLa cells on the three subgroups indicated by horizontal bars in Figure 1B, determined from high-throughput sequencing. For each gene, the number of sequence reads mapped to the vicinity of the TSS (10 kb upstream or downstream) was smoothed with a moving average of 300 bp. The smoothed data was averaged over RNF20-independent genes (black), RNF20-dependent genes (down-regulated in siRNF20, green) and RNF20-suppressed genes (up-regulated in siRNF20, red). Position 0 denotes the TSS. (B) Average values of expression and chromatin features in HeLa cells (siLacZ) for the subgroups indicated by horizontal bars in Figure 1B. Subgroups are designated as in A. Average expression in HeLa cells was calculated for each individual gene on the basis of the siLacZ microarrays in Figure 1A. The open chromatin score of each gene was defined by the closest genomic position assayed in the microarrays of Gilbert et al. (2004). All other chromatin features, including Pol II occupancy at the TSS and in the promoter-proximal part of the transcribed region (TR), as well as extent of histone H2B ubiquitylation (H2Bub), histone H3 Lys 4 trimethylation (H3K4me3), and acetylation of histone H3 Lys 9 and Lys 14 (H3K9/14ac) were determined by ChIP/chip analysis with appropriate antibodies and a custom tiling array (see Materials and Methods). Only probes overlapping the TSS and the transcribed region were included in the analysis. H2Bub signals were normalized to total H2B, H3 modifications were normalized to total H3, and Pol II signals were normalized to input DNA. All properties were further normalized to zero mean and unit standard deviation (Std), by subtracting their means and dividing by their Std. Error bars were calculated by bootstrapping. (*) _P_-value <0.05; (**) _P_-value <0.01 of regulated genes (red, green) relative to nonregulated genes (black). See Supplemental Table 3 for a complete list of _P_-values. (C) Correlation between modifications at different positions, calculated over 3000 genes represented in the custom array. For each pair of positions (relative to the TSS), we calculated the correlation between H2Bub at one position and H2Bub, H3K4me3, or H3K9/14ac at the other position. Positions are grouped into promoter (Prom), TSS, promoter-proximal part of the transcribed region (TR), middle (M) and end (E) of the transcribed region. (D) Correlation between differential expression changes and changes in histone H3 Lys 4 trimethylation (top) or histone H3 acetylation (bottom) upon RNF20 depletion. Gene group assignments (up-regulated or down-regulated by siRNF20) were as in Figure 1B. Histone modification data was obtained through ChIP/chip analysis using the custom array described in B probed with chromatin prepared form HeLa cells (either siRNF20 or siLacZ). For each position relative to the TSS, the 750 genes with the largest increase or decrease in the indicated modification at that position upon RNF20 knockdown were selected, and the ratio between the number of siRNF20 up-regulated genes and siRNF20 down-regulated genes within this set was calculated. Within the first 2.5 Kb of the transcribed region, increases in either modification were preferentially associated with up-regulation by siRNF20 and decreases in either modification were preferentially associated with down-regulation by siRNF20, while such associations were not observed at the promoter region or at the middle (mid) or end of the coding region.
Figure 3.
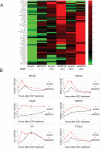
RNF20 modulates the expression of genes induced by EGF. (A) Clustering analysis of genes up-regulated by both RNF20 knockdown and EGF (20 ng/mL). Genes were included on the basis of the microarray data in Figure 1B (Supplemental Tables 1, 2). Each column represents expression values following the treatment indicated at the bottom. Log2 expression values of each gene were normalized into [0, 1], where 0 and 1 indicate the lowest and highest expression value of that gene in the six treatments, respectively. (B) qRT–PCR analysis of changes in the expression levels of the indicated representative genes at various times after exposure to EGF of HeLa cells transiently transfected with RNF20 siRNA (red) or LacZ siRNA (black). All values are normalized to GAPDH mRNA.
Figure 4.
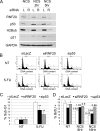
Knockdown of RNF20 compromises p53 activation. (A) MCF10A cells were transiently transfected with RNF20 siRNA (siRNF20) or LacZ siRNA (siLacZ) as control. Forty-eight hours later, cells were treated with NCS (200 ng/μL) for 2 and 5 h, and harvested. Equal amounts of protein from each sample were resolved by SDS-PAGE, followed by Western blot analysis with antibodies against p53 (DO1+PAb1801), RNF20, p21, H2Bub, and GAPDH. (B) HCT116 cells were transiently transfected with RNF20 siRNA, p53 siRNA, or LacZ siRNA as control. Forty-eight hours later cells were treated with 5-FU (50 μg/mL) for 24 h, harvested, fixed, and subjected to FACS-assisted DNA content analysis. (NT) Nontreated. (C) Quantification of the percentage of cells with sub-G1 DNA content, indicative of apoptosis, in HCT116 cells treated or not treated with 5-FU. Values were averaged from three independent experiments as in B. (**) _P_-value <0.01. (D) U2OS cells were transfected as in B. Forty-eight hours later, cells were treated with NCS (200 ng/μL) for 8 or 16 h, and BrdU incorporation was analyzed by FACS. The _Y_-axis indicates the percentage of BrdU-positive cells. (NT) Nontreated. Numerical values above each bar denote the extent of BrdU incorporation relative to the nontreated sample of the corresponding siRNA-transfected population.
Figure 5.
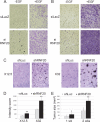
RNF20 knockdown increases EGF-induced cell migration and anchorage independent cell proliferation. (A,B) MCF10A cells (50,000 [_A_] or 80,000 [_B_]) were transiently transfected with RNF20 siRNA (siRNF20) or LacZ siRNA (siLacZ) and plated 48 h later in the upper compartment of a 24-well Transwell tray (Corning). Cells were allowed to migrate for 16 h with or without EGF. Migrating cells were visualized by staining the membrane with methyl violet followed by photography under a binocular. (C) NIH3T3 cells (100,000 per 3.5cm dish), stably expressing lentivirus-encoded RNF20-specific shRNA (shRNF20) or shLuciferase were plated in soft agar. Two weeks later, colonies were photographed under a binocular at the indicated magnification. (D) Quantification of the data in C. See the Materials and Methods for details. (E) NIH 3T3 cells stably expressing RNF20 shRNA (clone #1) or Luciferase shRNA (shLuc) as a control were resuspended in PBS and injected subcutaneously into the left flank of nude mice. Tumor size (in square millimeters) was determined by caliper measurement 1 and 2 wk after injection.
Figure 6.
RNF20 overexpression reduces HeLa cell migration. HeLa cells were transiently transfected with RNF20 siRNA (siRNF20) or LacZ siRNA (siLacZ) and plated 48 h later in the upper compartment of a 24-well Transwell tray (Corning). Cells were allowed to migrate for 16 h. Migrating cells were visualized by staining the membrane with methyl violet followed by photography under a binocular. Experiments were performed in triplicate. Each panel corresponds to a different transwell.
Figure 7.
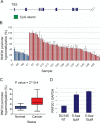
The RNF20 promoter is hypermethylated in breast cancer tumors. (A) Schematic map of the human RNF20 locus. Green box indicates the CpG island. Only the first nine exons are shown (blue boxes). (B) Genomic DNA from 56 breast cancer tumors (C) and 12 normal breast tissue specimens (N) was subjected to methylation-specific qPCR. Each bar depicts the relative methylation level of the CpG island located upstream of the RNF20 gene in an individual DNA sample, relative to a universal methylated human DNA standard, set as 100%. Alu primers were used in order to normalize for the total amount of genomic DNA in each sample. (C) Statistical analysis of the data in B. Boxes represent the values of 50% of the samples of each group. The horizontal bar within each box represents the mean of all samples, and vertical lines show the lowest and highest value. (D) DU145 cells were treated with 5 μM or 10 μM of 5-Aza-2′-Deoxycytidine (5-Aza), or left untreated (NT). Four days later, cells were harvested, and RNA was extracted. RNF20 mRNA was quantified by qRT–PCR and normalized to GAPDH.
Comment in
- Histone H2B ubiquitination: the cancer connection.
Espinosa JM. Espinosa JM. Genes Dev. 2008 Oct 15;22(20):2743-9. doi: 10.1101/gad.1732108. Genes Dev. 2008. PMID: 18923072 Free PMC article.
Similar articles
- RNF20 inhibits TFIIS-facilitated transcriptional elongation to suppress pro-oncogenic gene expression.
Shema E, Kim J, Roeder RG, Oren M. Shema E, et al. Mol Cell. 2011 May 20;42(4):477-88. doi: 10.1016/j.molcel.2011.03.011. Mol Cell. 2011. PMID: 21596312 Free PMC article. - Regulation of homologous recombination by RNF20-dependent H2B ubiquitination.
Nakamura K, Kato A, Kobayashi J, Yanagihara H, Sakamoto S, Oliveira DV, Shimada M, Tauchi H, Suzuki H, Tashiro S, Zou L, Komatsu K. Nakamura K, et al. Mol Cell. 2011 Mar 4;41(5):515-28. doi: 10.1016/j.molcel.2011.02.002. Mol Cell. 2011. PMID: 21362548 - WAC, a functional partner of RNF20/40, regulates histone H2B ubiquitination and gene transcription.
Zhang F, Yu X. Zhang F, et al. Mol Cell. 2011 Feb 18;41(4):384-97. doi: 10.1016/j.molcel.2011.01.024. Mol Cell. 2011. PMID: 21329877 Free PMC article. - RNF20-RNF40: A ubiquitin-driven link between gene expression and the DNA damage response.
Shiloh Y, Shema E, Moyal L, Oren M. Shiloh Y, et al. FEBS Lett. 2011 Sep 16;585(18):2795-802. doi: 10.1016/j.febslet.2011.07.034. Epub 2011 Aug 4. FEBS Lett. 2011. PMID: 21827756 Review. - Role of RNF20 in cancer development and progression - a comprehensive review.
Sethi G, Shanmugam MK, Arfuso F, Kumar AP. Sethi G, et al. Biosci Rep. 2018 Jul 12;38(4):BSR20171287. doi: 10.1042/BSR20171287. Print 2018 Aug 31. Biosci Rep. 2018. PMID: 29934362 Free PMC article. Review.
Cited by
- "Smurf"-ing tumors on the chromatin through RNF20.
Tsai WW. Tsai WW. Protein Cell. 2012 Feb;3(2):81-3. doi: 10.1007/s13238-012-2010-0. Protein Cell. 2012. PMID: 22351504 Free PMC article. No abstract available. - Histone H2Bub1 deubiquitylation is essential for mouse development, but does not regulate global RNA polymerase II transcription.
Wang F, El-Saafin F, Ye T, Stierle M, Negroni L, Durik M, Fischer V, Devys D, Vincent SD, Tora L. Wang F, et al. Cell Death Differ. 2021 Aug;28(8):2385-2403. doi: 10.1038/s41418-021-00759-2. Epub 2021 Mar 17. Cell Death Differ. 2021. PMID: 33731875 Free PMC article. - Epigenetic Control of Infant B Cell Precursor Acute Lymphoblastic Leukemia.
de Barrios O, Parra M. de Barrios O, et al. Int J Mol Sci. 2021 Mar 18;22(6):3127. doi: 10.3390/ijms22063127. Int J Mol Sci. 2021. PMID: 33803872 Free PMC article. Review. - R-loops and genomic instability in Bre1 (RNF20/40)-deficient cells.
Chernikova SB, Brown JM. Chernikova SB, et al. Cell Cycle. 2012 Aug 15;11(16):2980-4. doi: 10.4161/cc.21090. Epub 2012 Jul 24. Cell Cycle. 2012. PMID: 22825248 Free PMC article. - EGF/EGFR upregulates and cooperates with Netrin-4 to protect glioblastoma cells from DNA damage-induced senescence.
Li L, Huang Y, Gao Y, Shi T, Xu Y, Li H, Hyytiäinen M, Keski-Oja J, Jiang Q, Hu Y, Du Z. Li L, et al. BMC Cancer. 2018 Dec 4;18(1):1215. doi: 10.1186/s12885-018-5056-4. BMC Cancer. 2018. PMID: 30514230 Free PMC article.
References
- Amit I., Citri A., Shay T., Lu Y., Katz M., Zhang F., Tarcic G., Siwak D., Lahad J., Jacob-Hirsch J., et al. A module of negative feedback regulators defines growth factor signaling. Nat. Genet. 2007;39:503–512. - PubMed
- Barski A., Cuddapah S., Cui K., Roh T.Y., Schones D.E., Wang Z., Wei G., Chepelev I., Zhao K. High-resolution profiling of histone methylations in the human genome. Cell. 2007;129:823–837. - PubMed
- Berger S.L. The complex language of chromatin regulation during transcription. Nature. 2007;447:407–412. - PubMed
Publication types
MeSH terms
Substances
LinkOut - more resources
Full Text Sources
Other Literature Sources
Molecular Biology Databases
Research Materials
Miscellaneous
