p66Shc-generated oxidative signal promotes fat accumulation - PubMed (original) (raw)
p66Shc-generated oxidative signal promotes fat accumulation
Ina Berniakovich et al. J Biol Chem. 2008.
Abstract
Reactive oxygen species (ROS) and insulin signaling in the adipose tissue are critical determinants of aging and age-associated diseases. It is not clear, however, if they represent independent factors or they are mechanistically linked. We investigated the effects of ROS on insulin signaling using as model system the p66(Shc)-null mice. p66(Shc) is a redox enzyme that generates mitochondrial ROS and promotes aging in mammals. We report that insulin activates the redox enzyme activity of p66(Shc) specifically in adipocytes and that p66(Shc)-generated ROS regulate insulin signaling through multiple mechanisms, including AKT phosphorylation, Foxo localization, and regulation of selected insulin target genes. Deletion of p66(Shc) resulted in increased mitochondrial uncoupling and reduced triglyceride accumulation in adipocytes and in vivo increased metabolic rate and decreased fat mass and resistance to diet-induced obesity. In addition, p66(Shc-/-) mice showed impaired thermo-insulation. These findings demonstrate that p66(Shc)-generated ROS regulate the effect of insulin on the energetic metabolism in mice and suggest that intracellular oxidative stress might accelerate aging by favoring fat deposition and fat-related disorders.
Figures
FIGURE 1.
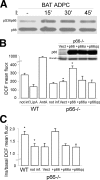
p66Shc redox activity in adipocyte. A, p66Shc Ser-36 phosphorylation before and after insulin treatment (at the indicated time points) of BAT adipocytes (ADPC). Anti-Shc immunoprecipitates were analyzed by WB using antibodies against phosphorylated (upper panel) or total (lower panel) p66Shc.B, fluorescence-activated cell sorter analysis of the mean DCF fluorescence of DCFDA-stained WT BAT adipocytes under basal conditions (not inf.) or after lipoic acid (LipA) or antimycin A (AntA) treatment, and p66Shc-/- BAT adipocytes under basal conditions (not inf.) or after infection with empty retroviral vector (Vect), or retroviral vectors expressing p66Shc, p66Shc_a_, or p66Shc_qq_ whose expression levels, as detected by WB in one representative experiment, are shown in the pictures on the right. C, insulin induced increase of DCF mean fluorescence (ratio between the mean fluorescence of insulin stimulated and untreated cells) in WT BAT adipocytes and p66Shc-/- BAT adipocytes under basal conditions (not inf.) or after infection with empty retroviral vector (Vect), or retroviral vectors expressing p66Shc, p66Shc_a_, or p66Shc_qq_.
FIGURE 2.
p66Shc regulation of Akt phosphorylation. A, WT and p66Shc-/- BAT adipocytes were starved (S) or treated with insulin (Ins) and analyzed at the indicated time points. Top four panels: WB of total (Akt) and phosphorylated (P-Akt) AKT, phosphorylated MAPK (P-MAPK), and vinculin.Bottom three panels: WB of anti-IRS1 immunoprecipitates using antibodies against IRS-1, pY-IRS-1, and p85a. B, densitometric analysis of P-Akt signals; the phospho-Akt signal was normalized against total-Akt signal (average values from three independent experiments:* and  ,p < 0.01).
FIGURE 3.
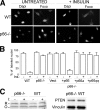
p66Shc regulation of insulin-induced Foxo re-localization. A, 4,6-diamidino-2-phenylindole (Dapi) staining of nuclei and immunofluorescence analysis of Foxo1 localization in untreated and insulin-treated WT and p66Shc-/- BAT adipocytes. Images are representative of four experiments which gave comparable results.B, percentage of untreated and insulin-treated BAT adipocytes with Foxo1 nuclear localization (results from three experiments). C, Western blot analysis using non-reducing PAGE (left panel) of reduced (R) versus oxidized (O) forms of PTEN in WT and p66Shc-/- BAT adipocytes before (-) and after (+) insulin (I) treatment and using standard reducing SDS-PAGE (right panel) of total PTEN in WT and p66Shc-/- BAT adipocytes. Images are representative of four experiments which gave comparable results.
FIGURE 4.
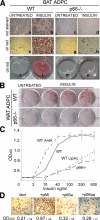
p66Shc regulation of insulin-induced triglyceride accumulation. A, white light microscopy pictures (a-h) and plate micrographs (i-n) of unstained (a-d) and Oil red-stained (e-h, i-n) BAT adipocytes (ADPC) from WT and p66Shc-/- mice. Cells were left untreated (a, e, c, g, i, and m) or treated with insulin for 6 days (b, f, d, h, l, and n). B, micrographs of plates of Oil red-stained WT and p66Shc-/- WAT adipocytes (ADPC) untreated and after insulin treatment. C, optical density (OD) values of Oil red extracts from stained WT, antimycin A (AntA)-, or lipoic acid (LipAc)-treated WT and p66Shc-/- BAT adipocytes (average of eight independent experiments for each condition). D, white light microscopy pictures of Oil red-stained p66Shc-/- BAT adipocytes infected with empty (Vect), p66Shc, p66Shc_a_, or p66Shc_qq_ retroviruses and treated with insulin and their corresponding optical density (OD; 490 nm) values.
FIGURE 5.
p66Shc regulation of energetic substrate consumption and insulin-dependent gene expression in adipocytes. A and_B_, cells were labeled with [14C]oleate, left untreated, or treated with insulin as indicated. FA uptake and release were measured as14C incorporation (A) and 14CO2 release (B). C, quantitative RT-PCR analysis of transcripts from the indicated genes in WT and p66Shc-/- adipocytes untreated or treated with insulin as indicated. Results are shown as ratio of values from insulin treated versus untreated samples. D, QPCR analysis of transcripts from the indicated genes in WT adipocytes treated (p66Shc-siRNA) or not (C) with siRNA oligos for p66Shc (resulting p66Shc levels are shown in the_upper panel_). Results from three QPCR measurements, each performed on two different siRNA experiments, were reported. *, , and °, p < 0.05.
FIGURE 6.
Energetic metabolism of WT and p66Shc-**/**- adipocytes. A, representative oxygraph analysis (left panel) of WT and p66Shc-/--minced BAT tissue. The_graph_ on the right reports the results from three independent experiments. * and , p < 0.01.B, protonmotive force of WT and p66Shc-/- BAT mitochondria. Results from three independent experiments are reported.*, p < 0.05. C, quantitative RT-PCR analysis of UCP1 gene expression in WT and p66Shc-/- adipocytes (BAT ADPCs) (untreated or after insulin treatment; left panel) and BAT, basal, and cold exposure (right panel). D, Western blotting analysis of UCP1 protein expression in BAT from adults and newborn WT and p66Shc-/- mice.
FIGURE 7.
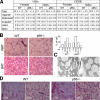
p66Shc regulation of fat accumulation in vivo.A, total body (T), fat pad (inguinal, abdominal, and scapular), heart (H), and brain (B) weight in 129Sv or C57Bl6 p66Shc-/- mice (±S.D.; n = 20 per group; , *, and ° indicates p < 0.01 in the comparison of all WT versus p66-/- groups in the row). B, hematoxylin/eosin-staining of WAT and BAT from 8-month-old male mice (left panel) and cell size distribution from the same samples (right panel). Data represent the result of the analysis of 10 different mice per group. C, electron microscopy of WT and p66Shc BAT.D, hematoxylin/eosin-staining of WT and p66Shc-/- BAT adipocytes transplants.
FIGURE 8.
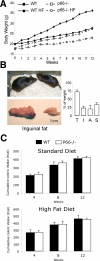
p66Shc-**/**- prevention of obesity. A, body weight curves of WT and p66Shc-/- male mice fed standard or HF diets. B, comparative view of representative p66Shc-/- and WT mice and inguinal fat pads from the same experiment. Total body (T) and fat pads (I, inguinal; A, abdominal; S, intrascapular) weight upon HF diet, expressed as in A (right panel). C, cumulative caloric intake of WT and p66Shc-/- mice at different time points during supplementation with standard (upper graph) and high fat (lower graph) diets.
FIGURE 9.
Function of the fat tissue in WT and p66Shc-/- mice. A, O2 consumption over 24 h of WT and p66Shc-/- mice (n = 8 per group); *, p < 0.01. B, daily energy expenditure of male WT and p66Shc-/- male mice (n = 8 per group); *,p < 0.01. Shown is the daily body temperature values of WT and p66Shc-/- mice (C) and during cold exposure (D) (n = 12 per group); *, p < 0.01.
Similar articles
- Canonical Wnt signaling induces vascular endothelial dysfunction via p66Shc-regulated reactive oxygen species.
Vikram A, Kim YR, Kumar S, Naqvi A, Hoffman TA, Kumar A, Miller FJ Jr, Kim CS, Irani K. Vikram A, et al. Arterioscler Thromb Vasc Biol. 2014 Oct;34(10):2301-9. doi: 10.1161/ATVBAHA.114.304338. Epub 2014 Aug 21. Arterioscler Thromb Vasc Biol. 2014. PMID: 25147340 Free PMC article. - The p66(Shc) redox adaptor protein is induced by saturated fatty acids and mediates lipotoxicity-induced apoptosis in pancreatic beta cells.
Natalicchio A, Tortosa F, Labarbuta R, Biondi G, Marrano N, Carchia E, Leonardini A, Cignarelli A, Bugliani M, Marchetti P, Fadini GP, Giorgio M, Avogaro A, Perrini S, Laviola L, Giorgino F. Natalicchio A, et al. Diabetologia. 2015 Jun;58(6):1260-71. doi: 10.1007/s00125-015-3563-2. Epub 2015 Mar 26. Diabetologia. 2015. PMID: 25810038 - p66(Shc)-induced redox changes drive endothelial insulin resistance.
Paneni F, Costantino S, Cosentino F. Paneni F, et al. Atherosclerosis. 2014 Oct;236(2):426-9. doi: 10.1016/j.atherosclerosis.2014.07.027. Epub 2014 Aug 5. Atherosclerosis. 2014. PMID: 25150941 - p66(Shc) protein, oxidative stress, and cardiovascular complications of diabetes: the missing link.
Francia P, Cosentino F, Schiavoni M, Huang Y, Perna E, Camici GG, Lüscher TF, Volpe M. Francia P, et al. J Mol Med (Berl). 2009 Sep;87(9):885-91. doi: 10.1007/s00109-009-0499-3. Epub 2009 Jul 10. J Mol Med (Berl). 2009. PMID: 19590843 Review. - Modulation of Obesity and Insulin Resistance by the Redox Enzyme and Adaptor Protein p66Shc.
Ciciliot S, Fadini GP. Ciciliot S, et al. Int J Mol Sci. 2019 Feb 24;20(4):985. doi: 10.3390/ijms20040985. Int J Mol Sci. 2019. PMID: 30813483 Free PMC article. Review.
Cited by
- The redox protein p66(shc) mediates cochlear vascular dysfunction and transient noise-induced hearing loss.
Fetoni AR, Eramo SL, Paciello F, Rolesi R, Samengo D, Paludetti G, Troiani D, Pani G. Fetoni AR, et al. Sci Rep. 2016 May 9;6:25450. doi: 10.1038/srep25450. Sci Rep. 2016. PMID: 27157635 Free PMC article. - Adipocyte-Specific Deletion of Manganese Superoxide Dismutase Protects From Diet-Induced Obesity Through Increased Mitochondrial Uncoupling and Biogenesis.
Han YH, Buffolo M, Pires KM, Pei S, Scherer PE, Boudina S. Han YH, et al. Diabetes. 2016 Sep;65(9):2639-51. doi: 10.2337/db16-0283. Epub 2016 Jun 9. Diabetes. 2016. PMID: 27284109 Free PMC article. - The oxidoreductase p66Shc acts as tumor suppressor in BRAFV600E-transformed cells.
Furlan T, Khalid S, Nguyen AV, Günther J, Troppmair J. Furlan T, et al. Mol Oncol. 2018 Jun;12(6):869-882. doi: 10.1002/1878-0261.12199. Epub 2018 May 5. Mol Oncol. 2018. PMID: 29624862 Free PMC article. - Mice with low levels of Shc proteins display reduced glycolytic and increased gluconeogenic activities in liver.
Hagopian K, Kim K, López-Dominguez JA, Tomilov AA, Cortopassi GA, Ramsey JJ. Hagopian K, et al. Biochem Biophys Rep. 2016 Sep;7:273-286. doi: 10.1016/j.bbrep.2016.06.021. Epub 2016 Jun 30. Biochem Biophys Rep. 2016. PMID: 28133633 Free PMC article. - Oxidative stress in cardiovascular diseases and obesity: role of p66Shc and protein kinase C.
De Marchi E, Baldassari F, Bononi A, Wieckowski MR, Pinton P. De Marchi E, et al. Oxid Med Cell Longev. 2013;2013:564961. doi: 10.1155/2013/564961. Epub 2013 Mar 27. Oxid Med Cell Longev. 2013. PMID: 23606925 Free PMC article. Review.
References
- Clancy, D. J., Gems, D., Harshman, L. G., Oldham, S., Stocker, H., Hafen, E., Leevers, S. J., and Partridge, L. (2001) Science 292 104-106 - PubMed
- Giannakou, M. E., Goss, M., Junger, M. A., Hafen, E., Leevers, S. J., and Partridge, L. (2004) Science 305 361. - PubMed
- Hwangbo, D. S., Gershman, B., Tu, M. P., Palmer, M., and Tatar, M. (2004) Nature 429 562-566 - PubMed
- Bluher, M., Kahn, B. B., and Kahn, C. R. (2003) Science 299 572-574 - PubMed
- Bluher, M., Michael, M. D., Peroni, O. D., Ueki, K., Carter, N., Kahn, B. B., and Kahn, C. R. (2002) Dev. Cell 3 25-38 - PubMed
Publication types
MeSH terms
Substances
LinkOut - more resources
Full Text Sources
Other Literature Sources
Molecular Biology Databases
Miscellaneous
