Epistasis--the essential role of gene interactions in the structure and evolution of genetic systems - PubMed (original) (raw)
Review
Epistasis--the essential role of gene interactions in the structure and evolution of genetic systems
Patrick C Phillips. Nat Rev Genet. 2008 Nov.
Abstract
Epistasis, or interactions between genes, has long been recognized as fundamentally important to understanding the structure and function of genetic pathways and the evolutionary dynamics of complex genetic systems. With the advent of high-throughput functional genomics and the emergence of systems approaches to biology, as well as a new-found ability to pursue the genetic basis of evolution down to specific molecular changes, there is a renewed appreciation both for the importance of studying gene interactions and for addressing these questions in a unified, quantitative manner.
Figures
Figure 1
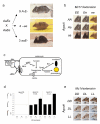
Different viewpoints of epistasis. Coat color variation in mammals has long served as one of most fruitful examples of genetics, with over 120 loci and 800 alleles described in mice alone. The coat color genetic pathway can be used to illustrate different usages of the term “epistasis”. In the original sense, from Bateson, epistasis arises when the effects of alleles at one locus are blocked by the presence of a specific allele at another locus. (a) For example, a cross between an agouti and extension (now called the melancortin 1 receptor or Mc1r) double heterozygotes yields the non-Mendelian segregation ratio of 9:4:3 (instead of 9:3:3:1), with the excess of dusty yellow extension offspring suggesting that the Mc1r locus operates downstream of agouti (an example of recessive epistasis). Crosses with other mutants can be used to further order the genetic pathway, relying on combinations of knockout mutants to generate compositional epistasis (Box 1). (b) The outcomes of this same cross can be illustrated in a 3×3 genotype interaction table that is common in population genetics. (c) The biochemistry of this pathway within the melanocyte has since been fully worked out. Here, activation of Mc1r turns on the production of the (dark) eumelanin, as opposed to (the yellow/red) pheomelanin. Agouti acts an antagonist to Mc1r such that periodic activation of agouti leads to banding of color on individual hairs. Disruption of other loci, such as the classic albino (Try) locus, destroys function of the entire pathway. The specific interactions between the proteins in this pathway are representative of functional epistasis. (d) Recently, Steiner et al. have used this pathway to probe natural variation between dark forest mice and light colored beach mice. They find that the adaptive transition from dark to light that accompanied the movement of mice from the forest to the beach is accomplished by an interaction between structural changes to the agouti locus and regulatory changes to the Mc1r locus. The specific effects of these interactions can be roughly quantified by averaging the effects of these markers overall all sampled genetic backgrounds to give an estimate of the statistical epistasis between these loci. (e) Interestingly, the pattern of epistasis for these loci in nature is reversed from the standard cross, presumably because the Mc1r allele in the beach mice has partial function and is therefore still susceptible to suppression from agouti. This later observation is a clear illustration that epistasis is a property of specific alleles, rather than a particular locus in general. Pictures for (a, b) reprinted with permission from Ref . Images are representative of similar phenotypes. (c) is modified from Ref 104). (d) is from Ref . Images for (e) kindly supplied by Hopi Hoekstra.
Figure 2
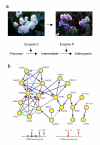
Reconstructing genetic pathways using epistasis analysis. (a) A classical example of epistasis using flower color in sweet peas. Combinations of mutations at two loci generating enzymes responsible for processing anthocyanin operate within a single biochemical pathway. Picture reprinted from Ref . (b) Construction of the epistatic network of genes underlying sensitivity to the mutagen methyl methanesulfanate (MMS) in yeast. The fitness of all 650 combinations of 26 genes known to be sensitive to MMS were measured quantitatively; combinations showing departures from multiplicative interactions are connected in the network. Arrows represent five interaction subtypes: coequal (green), partial masking (light blue), masking (dark blue), partial suppression (purple), suppression (pink). Reprinted from Ref .
Figure 3
Epistasis in complex traits. (a) More than forty generations of selection on body size in chickens lead to a large difference among lines. (b) QTL mapping of an F2 cross between the divergent body size lines revealed a network of six genes that explains 45% of the among line difference. Five of these loci are only show their effects via epistasis with the sixth (Growth9). (c) An example of one of the genotype/phenotype relationship between two of these genes. Note the large difference in the double Growth12/Growth9 high line homozygotes. (d) Epistasis in the autoimmune reaction thought to underlie many cases of multiple sclerosis. Mice that had been transformed to produce human T-cell antigen receptors, are then also subsequently transformed to express the human major histocompatibility (MHC) locus DRB5*0101 (DR2a), the MHC locus DRB1*1501 (DR2b), or both. The incidence of disease is much lower when both loci are present, even though the DR2a locus does not independently influence disease onset. (e) These two loci encode antigen binding proteins that are expressed on the surface of an antigen presenting cell (APC). A possible model for the epistatic effect is that the overall antigenic effect is maintained by a balance between T-cell proliferation induced by DR2b and T-cell apoptosis induced by DR2a. The complex relationship between these two might explain the complex pattern of onset and periodic nature of some multiple sclerosis cases. (a-c) from Ref . (d) is based on data from Ref . (e) is adapted from Ref .
Figure 4
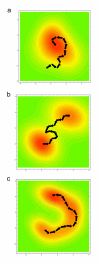
Four different views of the generation of epistasis under natural selection. Each figure shows a hypothetical adaptive landscape in which the mean fitness of a population is a function of underlying variation at two or more loci. Lines display points of equal fitness, with warmer colors indicating areas of higher fitness. (a) Under Fisherian Adaptation, adaptive evolution is seen as a hill climbing process in which new beneficial mutations that increase fitness build upon substitutions that are already fixed within the population. Here, epistasis is a byproduct of the historical contingency built into the evolutionary process (both from the random effects of mutations and shifts in the adaptive optimum), but at any given time point the average or additive effects of a particular mutation are responsible for the actual evolutionary change. (b) In Wright’s Shifting Balance Process, epistasis generates multiple adaptive peaks in the fitness landscape. If stable through time, these valleys can only be traversed via genetic drift or tight linkage. Here, epistasis plays a fundamental role in determining the direction and likelihood of any particular evolutionary change. (c) In Gavrelet’s Holy Landscape model, adaptive landscapes are rugged as in Wright’s case, but the multidimensional nature of the fitness landscape leads to ridges of nearly equal fitness that populations move along either via directional selection or genetic drift. This represented metaphorically here by a ridge of nearly equal fitness whose endpoints are spatially separated by a deep valley. In multidimensional space, this might be something more like a tunnel connecting regions of high fitness and avoiding complex adaptive valleys. Here, epistasis will be strongly apparent after populations diverge, and may impact the direction of evolutionary change, but does not generate a barrier to change as in Wright’s model.
Similar articles
- Beyond Genomics: Studying Evolution with Gene Coexpression Networks.
Ruprecht C, Vaid N, Proost S, Persson S, Mutwil M. Ruprecht C, et al. Trends Plant Sci. 2017 Apr;22(4):298-307. doi: 10.1016/j.tplants.2016.12.011. Epub 2017 Jan 23. Trends Plant Sci. 2017. PMID: 28126286 Review. - Predicting Evolution Using Regulatory Architecture.
Nghe P, de Vos MGJ, Kingma E, Kogenaru M, Poelwijk FJ, Laan L, Tans SJ. Nghe P, et al. Annu Rev Biophys. 2020 May 6;49:181-197. doi: 10.1146/annurev-biophys-070317-032939. Epub 2020 Feb 4. Annu Rev Biophys. 2020. PMID: 32040932 Review. - Dynamics in Epistasis Analysis.
Awdeh A, Phenix H, Karn M, Perkins TJ. Awdeh A, et al. IEEE/ACM Trans Comput Biol Bioinform. 2018 May-Jun;15(3):878-891. doi: 10.1109/TCBB.2017.2653110. Epub 2017 Jan 16. IEEE/ACM Trans Comput Biol Bioinform. 2018. PMID: 28092574 - Systems approaches in understanding evolution and evolvability.
Agarwal S. Agarwal S. Prog Biophys Mol Biol. 2013 Dec;113(3):369-74. doi: 10.1016/j.pbiomolbio.2013.09.004. Epub 2013 Oct 9. Prog Biophys Mol Biol. 2013. PMID: 24120732 Review. - Organization principles in genetic interaction networks.
Jacobs C, Segrè D. Jacobs C, et al. Adv Exp Med Biol. 2012;751:53-78. doi: 10.1007/978-1-4614-3567-9_3. Adv Exp Med Biol. 2012. PMID: 22821453 Review.
Cited by
- Biomarker Detection in Association Studies: Modeling SNPs Simultaneously via Logistic ANOVA.
Jung Y, Huang JZ, Hu J. Jung Y, et al. J Am Stat Assoc. 2014 Dec 1;109(508):1355-1367. doi: 10.1080/01621459.2014.928217. J Am Stat Assoc. 2014. PMID: 25642005 Free PMC article. - eQTL Epistasis - Challenges and Computational Approaches.
Huang Y, Wuchty S, Przytycka TM. Huang Y, et al. Front Genet. 2013 May 31;4:51. doi: 10.3389/fgene.2013.00051. eCollection 2013. Front Genet. 2013. PMID: 23755066 Free PMC article. - Multiplexed tracking of combinatorial genomic mutations in engineered cell populations.
Zeitoun RI, Garst AD, Degen GD, Pines G, Mansell TJ, Glebes TY, Boyle NR, Gill RT. Zeitoun RI, et al. Nat Biotechnol. 2015 Jun;33(6):631-7. doi: 10.1038/nbt.3177. Epub 2015 Mar 23. Nat Biotechnol. 2015. PMID: 25798935 - Computational multigene interactions in virus growth and infection spread.
Schwab B, Yin J. Schwab B, et al. Virus Evol. 2023 Dec 28;10(1):vead082. doi: 10.1093/ve/vead082. eCollection 2024. Virus Evol. 2023. PMID: 38361828 Free PMC article. - Environmentally induced changes in correlated responses to selection reveal variable pleiotropy across a complex genetic network.
Sikkink KL, Reynolds RM, Cresko WA, Phillips PC. Sikkink KL, et al. Evolution. 2015 May;69(5):1128-42. doi: 10.1111/evo.12651. Epub 2015 May 7. Evolution. 2015. PMID: 25809411 Free PMC article.
References
- Phillips PC, Otto SP, Whitlock MC. In: Epistasis and the Evolutionary Process. Wolf JD, Brodie ED III, Wade MJ, editors. Oxford University Press; Oxford, England: 2000.
- Malmberg RL, Mauricio R. QTL-based evidence for the role of epistasis in evolution. Genet Res. 2005;86:89–95. - PubMed
- Otto SP, Gerstein AC. Why have sex? The population genetics of sex and recombination. Biochem Soc Trans. 2006;34:519–522. - PubMed
- Weinreich DM, Watson RA, Chao L. Perspective: Sign epistasis and genetic constraint on evolutionary trajectories. Evolution. 2005;59:1165–1174. - PubMed
Publication types
MeSH terms
LinkOut - more resources
Full Text Sources
Other Literature Sources


