Turning astrocytes from the rostral migratory stream into neurons: a role for the olfactory sensory organ - PubMed (original) (raw)
Turning astrocytes from the rostral migratory stream into neurons: a role for the olfactory sensory organ
Mariana Alonso et al. J Neurosci. 2008.
Abstract
Neurogenesis persists within a few restricted areas of the adult mammalian brain, giving rise to neurons that functionally integrate into preexisting circuits. One of these areas, the subventricular zone (SVZ), was believed, until recently, to be the unique source providing the adult olfactory bulb (OB) with newborn neurons. Because of the fact that neuroblasts derived in the SVZ migrate through the rostral migratory stream (RMS) en route to the OB, the existence of candidate neural stem cells within the RMS was long overlooked. Here, we confirm and considerably extend recent evidence for the existence of adult neural stem cells within the RMS, and go on to investigate their proliferative regulation. Specifically targeting RMS-astrocytes with lentiviral vectors encoding GFP, we demonstrate that glial cells in the RMS differentiate into both OB granule and periglomerular interneurons. In addition, ultrastructural analysis unambiguously reveals the astrocytic nature of stem cells in the adult RMS, and patch-clamp recordings demonstrate the functional integration of RMS-derived interneurons into OB circuitry. Proliferative regulation was investigated via two contrasting manipulations: exposure to an odor-enriched environment that enhances candidate stem cell proliferation in both the RMS and SVZ, and chemical lesion of the main olfactory epithelium that increases cell proliferation in the RMS only. New neurons in the adult OB can therefore arise from different neurogenic areas that can be separately regulated.
Figures
Figure 1.
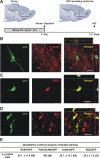
Identity of lentiviral-transduced cells in the RMS. A, GFP-encoding lentiviral vector, pseudotyped by the Mokola envelope, was injected into the RMS elbow of Ara-C treated mice. Animals were killed for analysis between 1 and 2 d postinjection (d.p.i.). B–D, Confocal micrographs showing infected cells at the injection site double-stained by immunofluorescence with GFP (green) and GFAP (B, red), S100ß (C, red) or NG2 (D, red). Images represent the maximal projections of each individual channel (left and middle), and the orthogonal analysis in a single optical plane (right). E, Quantitative analysis of double labeled cells detected at the injection site. Data are expressed as mean ± SEM of the percentages of double-labeled cells with respect to the total amount of GFP-expressing cells (from 2 to 4 mice). The total numbers of GFP-labeled cells analyzed are indicated in brackets. Scale bars: 20 μm. IHC, immunohistochemistry; SVZ, subventricular zone; RMS, rostral migratory steam; OB, olfactory bulb; LV, lateral ventricle; ND, not detected.
Figure 2.
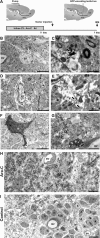
Identification of transfected cells by immunoelectromicroscopy. A, GFP-encoding Mokola vector was injected into the RMS elbow of Ara-C treated mice. Animals were killed for analysis at 1 d.p.i. B, D, GFP-expressing cells (B1, B2) showing light cytoplasm, irregular contours of cell surface and nonclumped chromatin typical for type-B1 astrocytes (B) or clumped chromatin typical for candidate stem cell type-B2 astrocytes (D). C, E, Details of panels B and D, respectively (white squares) showing examples of immunostaining of GFP in astrocyte cytoplasm. The electron dense precipitate of oxidized DAB was intentionally maintained at low intensity to facilitate ultrastructural identification of B astrocytes (arrows). F, GFP-expressing cell showing intentionally enhanced immunostaining of GFP in astrocytic cytoplasm. G, GFP-expressing cell showing typical astrocytic end foot apposed to the abluminal face of a blood vessel (arrow). H, Panorama showing the ultrastructure of the RMS elbow 1 d after the end of Ara-C treatment (Ara-C). Chains of neuroblasts were not observed and only astrocytes (B) could be detected. A mitotic figure is also shown (M). I, Panorama showing the ultrastructure of the RMS elbow in nontreated animals (Control) where chains of migrating neuroblasts (A) interspersed with astrocyte-like glial cells (B) are clearly distinguished. Magnification 1200× (B, D, F), 5000× (C, E), 2000× (G), 800× (H, I). Scale bars: 5 μm (B, D, F-I) and 1 μm (C, E). IEM, immunoelectron-microscopy; SVZ, subventricular zone; RMS, rostral migratory steam; OB, olfactory bulb; LV, lateral ventricle; BV, blood vessel.
Figure 3.
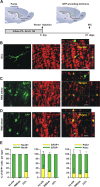
RMS-transduced cells generate newborn neurons in the adult OB. A, Lentiviral vector, pseudotyped by the Mokola envelope, was injected into the RMS elbow of Ara-C treated mice. Animals were killed for analysis at 21 d.p.i. B–D, Confocal micrographs showing GFP-expressing cells (green) double-stained with the neuronal marker NeuN (B, red) in the granular cell layer (GCL) indicating that RMS-infected cells generate neurons in the OB in vivo. Infected astrocytes (green) reactive to GFAP (C, red) were still detected at the injection site (RMS elbow). Neuroblasts double-stained with GFP (green) and PSA-NCAM (D, red) were also found in the RMS elbow at 21 d.p.i. Images represent the maximal projections of each individual channel (left and middle), and the orthogonal analysis in a single optical plane (right). E, Bar diagrams representing the percentage of double-labeled cells (yellow) with respect to total number of GFP-expressing cells (green + yellow) from n = 2 mice (total number of cells analyzed: 352, 223, 241 for NeuN, GFAP and PSA-NCAM, respectively). Scale bars: 20 μm. IHC, immunohistochemistry; SVZ, subventricular zone; RMS, rostral migratory steam; OB, olfactory bulb; LV, lateral ventricle; inj site, injection site; RMSob, rostral migratory stream entering the OB.
Figure 4.
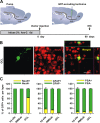
Neurogenic properties of the adult RMS. A, The Mokola vector was injected into the RMS elbow of Ara-C treated mice. Animals were killed for analysis at 90 d.p.i. B, Confocal micrographs showing GFP-expressing cells (green) in the GCL, double-stained with the neuronal marker NeuN (red). Images represent the maximal projections of each individual channel (left and middle), and the orthogonal analysis in a single optical plane (right). C, Bar diagrams representing the percentage of double-labeled cells (yellow) with respect to the total number of GFP-expressing cells (green + yellow) from 2 mice (total number of cells analyzed: 907, 375 and 375 for NeuN, GFAP and PSA-NCAM, respectively). Scale bar: 20 μm. IHC, immunohistochemistry, SVZ, subventricular zone; RMS, rostral migratory steam; OB, olfactory bulb; LV, lateral ventricle; GCL, granule cell layer; inj site, injection site; RMSob, the rostral migratory stream entering the OB.
Figure 5.
RMS-newborn cells become fully integrated neurons in the adult OB. A, The Mokola vector was injected into the RMS elbow of Ara-C treated mice. Animals were killed for analysis at 60 d.p.i. Electrophysiological whole-cell recordings from RMS-generated newborn (GFP+, in green) and preexisting granule cells (GFP−, in black) were performed in the granule cell layer from the same slices. B, Example of a GFP+ cell (green) recorded and filled with biocytin (revealed by streptavidin-conjugated Alexa 568, red). Confocal images shown represent the maximal projections of each individual channel (top), and the merged projection indicating the presence of both green and red fluorescence in the patched cell (yellow, bottom). Scale bar: 50 μm. C, Example of voltage-dependent Na+ current traces elicited by increasing depolarizing voltage steps (successive jumps of 10 mV from −110 mV) in both RMS-generated newborn (GFP+, in green) and preexisting granule cells (GFP−, in black). D, Na+ currents trigger spikes in current-clamp identically in both groups. Spikes are wide because voltage-gated potassium channels were blocked by our Cs-based intracellular solution, necessary for separate recording of glutamatergic and GABAergic synaptic inputs. E, Examples of traces of outward sIPSCs recorded from both groups (upper traces), and outward sIPSCs recorded in GFP+ newborn cells in standard conditions (std) or in the presence of the GABA antagonist gabazine (Gz, 10 μ
m
) (lower traces). Neurons were held at 0 mV, the reversal potential for glutamatergic events. F, Examples of traces of inward sEPSCs recorded from both groups of cells (upper traces), and inward sEPSCs recorded in GFP+ newborn cells in standard conditions (std) or in the presence of the AMPA antagonist NBQX (NBQX, 10 μ
m
) (lower traces). Neurons were held at −70 mV, the reversal potential for GABAergic events. Comparison between groups was performed by paired t tests (n = 6 pairs). SVZ, subventricular zone; RMS, rostral migratory steam; OB, olfactory bulb; LV, lateral ventricle.
Figure 6.
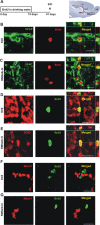
Candidate stem cells are present in the adult RMS. A, For long-term labeling of candidate stem cells, BrdU (1 mg/ml) was given to mice in their drinking water for 2 weeks. Animals were killed for analysis 26 d after the end of the treatment (day 41), giving sufficient time post-BrdU to allow the fast-dividing type-C cell population to be washed out, and for the neuroblasts in the RMS to reach the OB (Lemasson et al., 2005). B, C, Confocal micrographs showing candidate stem cells double-stained with GFAP (green) and BrdU (red) in the SVZ (B) and in the region including the RMS elbow and the horizontal limb (RMSelb-hl, C). Images shown represent the maximal projections of each individual channel (left and middle), and the orthogonal analysis in a single optical plane (right). D, E, Confocal micrographs showing candidate stem cells double-stained with SOX2, a marker of stem cells (red), and BrdU (green) in the same regions as boxed in B-C. Images show the maximal projections of each individual channel (left and middle), and the orthogonal analysis in a single optical plane (right). F, G, Confocal micrographs showing cells stained with Mash1 (red), a marker for type-C cells, and BrdU (green) in the same regions as specified in B, C. Images shown represent the maximal projections of each individual channel (left and middle), and the merged projection (right). Scale bars: 20 μm. IHC, immunohistochemistry; SVZ, subventricular zone; RMS, rostral migratory steam; OB, olfactory bulb; LV, lateral ventricle.
Figure 7.
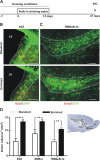
Temporary chemical lesion of the MOE increases candidate stem cell proliferation in the RMS. A, To study the effect of chemical ablation of the main olfactory epithelium (MOE) on candidate RMS-stem cell proliferation, mice were given i.p. injections of either dichlobenil (lesion; 25 μg/g body weight) or DMSO (control) on days 0, 2, and 4 in parallel with BrdU labeling. Animals were killed for analysis 26 d after the end of the treatment (day 41). B, To assess the lesion of the MOE, olfactory marker protein (OMP) staining (green) was analyzed in both DMSO controls (top) and dichlobenil-injected mice (Lesion, bottom). Examples of OMP staining 2 weeks after the beginning of the treatment are shown. Slices were counterstained with TOTO (blue) to reveal the glomerular structure. C, Fluorescent images showing examples of BrdU+ candidate stem cells (red) in the RMSelb-hl in both DMSO controls (top) and dichlobenil-treated mice (Lesion, bottom). The boundary of the analyzed region is outlined in white and is based on GFAP staining. Confocal images shown represent the maximal projections of merged channels. D, Chemical ablation of the MOE in dichlobenil-treated animals (Lesion) increased the number of BrdU-labeled cells in the RMS elbow-horizontal limb (RMSelb-hl) without affecting the subventricular zone (SVZ) or the RMS vertical limb (RMSvl). Comparison between treatments was performed by Bonferroni post-test after two-way ANOVA (n = 6 per group). *p < 0.05. Scale bars: 100 μm. IHC, immunohistochemistry; LV, lateral ventricle.
Figure 8.
Enriched odor exposure increases candidate stem cell proliferation in the SVZ and RMS. A, Mice were kept in standard conditions or in an enriched odor environment for 3 weeks. After 1 week normal tap water was replaced by BrdU (1 mg/ml) in their drinking water for 2 weeks. Animals were killed for analysis 26 d after the end of the treatment (day 41). B, C, Fluorescent images showing examples of BrdU+ candidate stem cells (red) and in the subventricular zone SVZ (B) and in the elbow-horizontal limb (RMSelb-hl) of the RMS (C) from standard (top) and enriched mice (bottom). The boundary of the analyzed region is outlined in white and is based on GFAP staining. Confocal images shown represent the maximal projections of merged channels. D, In enriched mice, the number of BrdU-labeled cells is increased in both the vertical (RMSvl) and the RMSelb-hl of the RMS and in the SVZ regions. Comparison between treatments was performed by Bonferroni post-test after two-way ANOVA (n = 6 per group). **p < 0.01, ***p < 0.001. Scale bars: 50 μm. IHC, immunohistochemistry; LV, lateral ventricle.
Similar articles
- Lineage analysis of quiescent regenerative stem cells in the adult brain by genetic labelling reveals spatially restricted neurogenic niches in the olfactory bulb.
Giachino C, Taylor V. Giachino C, et al. Eur J Neurosci. 2009 Jul;30(1):9-24. doi: 10.1111/j.1460-9568.2009.06798.x. Epub 2009 Jun 25. Eur J Neurosci. 2009. PMID: 19558606 - Age-dependent regional changes in the rostral migratory stream.
Mobley AS, Bryant AK, Richard MB, Brann JH, Firestein SJ, Greer CA. Mobley AS, et al. Neurobiol Aging. 2013 Jul;34(7):1873-81. doi: 10.1016/j.neurobiolaging.2013.01.015. Epub 2013 Feb 15. Neurobiol Aging. 2013. PMID: 23419702 Free PMC article. - Deprivation of sensory inputs to the olfactory bulb up-regulates cell death and proliferation in the subventricular zone of adult mice.
Mandairon N, Jourdan F, Didier A. Mandairon N, et al. Neuroscience. 2003;119(2):507-16. doi: 10.1016/s0306-4522(03)00172-6. Neuroscience. 2003. PMID: 12770564 - Relationship between Blood Vessels and Migration of Neuroblasts in the Olfactory Neurogenic Region of the Rodent Brain.
Martončíková M, Alexovič Matiašová A, Ševc J, Račeková E. Martončíková M, et al. Int J Mol Sci. 2021 Oct 25;22(21):11506. doi: 10.3390/ijms222111506. Int J Mol Sci. 2021. PMID: 34768936 Free PMC article. Review. - Adult neurogenesis and the olfactory system.
Whitman MC, Greer CA. Whitman MC, et al. Prog Neurobiol. 2009 Oct;89(2):162-75. doi: 10.1016/j.pneurobio.2009.07.003. Epub 2009 Jul 15. Prog Neurobiol. 2009. PMID: 19615423 Free PMC article. Review.
Cited by
- Neural stem cells in the diabetic brain.
Bachor TP, Suburo AM. Bachor TP, et al. Stem Cells Int. 2012;2012:820790. doi: 10.1155/2012/820790. Epub 2012 Nov 14. Stem Cells Int. 2012. PMID: 23213341 Free PMC article. - Neurogenesis drives stimulus decorrelation in a model of the olfactory bulb.
Chow SF, Wick SD, Riecke H. Chow SF, et al. PLoS Comput Biol. 2012;8(3):e1002398. doi: 10.1371/journal.pcbi.1002398. Epub 2012 Mar 15. PLoS Comput Biol. 2012. PMID: 22442645 Free PMC article. - Lake-front property: a unique germinal niche by the lateral ventricles of the adult brain.
Ihrie RA, Alvarez-Buylla A. Ihrie RA, et al. Neuron. 2011 May 26;70(4):674-86. doi: 10.1016/j.neuron.2011.05.004. Neuron. 2011. PMID: 21609824 Free PMC article. Review. - 5-HT receptors mediate lineage-dependent effects of serotonin on adult neurogenesis in Procambarus clarkii.
Zhang Y, Benton JL, Beltz BS. Zhang Y, et al. Neural Dev. 2011 Jan 4;6:2. doi: 10.1186/1749-8104-6-2. Neural Dev. 2011. PMID: 21205292 Free PMC article. - Paced-mating increases the number of adult new born cells in the internal cellular (granular) layer of the accessory olfactory bulb.
Corona R, Larriva-Sahd J, Paredes RG. Corona R, et al. PLoS One. 2011;6(5):e19380. doi: 10.1371/journal.pone.0019380. Epub 2011 May 27. PLoS One. 2011. PMID: 21637743 Free PMC article.
References
- Alvarez-Buylla A, Lim DA. For the long run: maintaining germinal niches in the adult brain. Neuron. 2004;41:683–686. - PubMed
- Alvarez-Buylla A, García-Verdugo JM, Tramontin AD. A unified hypothesis on the lineage of neural stem cells. Nat Rev Neurosci. 2001;2:287–293. - PubMed
- Battista D, Ferrari CC, Gage FH, Pitossi FJ. Neurogenic niche modulation by activated microglia: transforming growth factor beta increases neurogenesis in the adult dentate gyrus. Eur J Neurosci. 2006;23:83–93. - PubMed
Publication types
MeSH terms
Substances
LinkOut - more resources
Full Text Sources
Other Literature Sources
Research Materials
Miscellaneous
