Tim-3 expression defines a novel population of dysfunctional T cells with highly elevated frequencies in progressive HIV-1 infection - PubMed (original) (raw)
. 2008 Nov 24;205(12):2763-79.
doi: 10.1084/jem.20081398. Epub 2008 Nov 10.
Lishomwa C Ndhlovu, Jason D Barbour, Prameet M Sheth, Aashish R Jha, Brian R Long, Jessica C Wong, Malathy Satkunarajah, Marc Schweneker, Joan M Chapman, Gabor Gyenes, Bahareh Vali, Martin D Hyrcza, Feng Yun Yue, Colin Kovacs, Aref Sassi, Mona Loutfy, Roberta Halpenny, Desmond Persad, Gerald Spotts, Frederick M Hecht, Tae-Wook Chun, Joseph M McCune, Rupert Kaul, James M Rini, Douglas F Nixon, Mario A Ostrowski
Affiliations
- PMID: 19001139
- PMCID: PMC2585847
- DOI: 10.1084/jem.20081398
Tim-3 expression defines a novel population of dysfunctional T cells with highly elevated frequencies in progressive HIV-1 infection
R Brad Jones et al. J Exp Med. 2008.
Abstract
Progressive loss of T cell functionality is a hallmark of chronic infection with human immunodeficiency virus 1 (HIV-1). We have identified a novel population of dysfunctional T cells marked by surface expression of the glycoprotein Tim-3. The frequency of this population was increased in HIV-1-infected individuals to a mean of 49.4 +/- SD 12.9% of CD8(+) T cells expressing Tim-3 in HIV-1-infected chronic progressors versus 28.5 +/- 6.8% in HIV-1-uninfected individuals. Levels of Tim-3 expression on T cells from HIV-1-infected inviduals correlated positively with HIV-1 viral load and CD38 expression and inversely with CD4(+) T cell count. In progressive HIV-1 infection, Tim-3 expression was up-regulated on HIV-1-specific CD8(+) T cells. Tim-3-expressing T cells failed to produce cytokine or proliferate in response to antigen and exhibited impaired Stat5, Erk1/2, and p38 signaling. Blocking the Tim-3 signaling pathway restored proliferation and enhanced cytokine production in HIV-1-specific T cells. Thus, Tim-3 represents a novel target for the therapeutic reversal of HIV-1-associated T cell dysfunction.
Figures
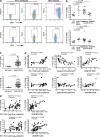
Figure 1.
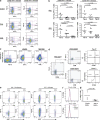
Tim-3 is up-regulated on T cells in HIV-1 infection, and its expression correlates with parameters of HIV-1 disease progression. (a) PBMCs from HIV-1–infected and uninfected subjects were stained with antibodies against CD4, CD8, CD3, and a biotinylated polyclonal goat anti–Tim-3 antibody, followed by a secondary streptavidin–APC conjugate. Plots show events gated on the CD3+ population, and subsequently on the CD8+ or CD4+ populations, from a representative HIV-1–uninfected subject and a chronically HIV-1–infected subject. Biotinylated normal goat serum was used as a negative control. (b) The percentages of Tim-3+ cells within CD8+ and CD4+ T cell populations are indicated for nine HIV-1–uninfected individuals and 31 individuals from the CIRC cohort separated into three groups: acute/early HIV-1 infected (7), HIV-1–infected chronic progressors (16), and HIV-1–infected viral controller (8), using polyclonal goat anti–Tim-3 antibody. (c) The percentages of Tim-3+ cells within CD8+ and CD4+ T cell populations are indicated for 60 treatment-naive HIV-1–infected individuals from the UCSF OPTIONS cohort of primary infection and 9 HIV-1–uninfected controls using PE-conjugated monoclonal anti–Tim-3 antibody. Subjects from the CIRC cohort were defined as follows: acute/early = infected with HIV-1 < 4 mo; chronic progressor = infected > 1 yr with CD4+ T cell count decline >50 cells/mm3/yr, viral controller infected >1 yr, no evidence of CD4+ T cell count decline, and viral load <5,000 copies/ml bDNA. Characteristics of the OPTIONS acute/early infection cohort are detailed in Materials and methods. Statistical analyses for both cohorts were performed using the Mann-Whitney test. (d and e) Correlations between Tim-3 expression on CD8+ and CD4+ T cells and viral load, CD4+ T cell counts, and levels of CD38 expression among individuals with available clinical data from the CIRC cohort (d) and OPTIONS cohort (e). Shown for the CIRC cohort are Tim-3 levels determined using a polyclonal anti–Tim-3 antibody. Confirmatory experiments were performed using a PE-conjugated monoclonal anti–Tim-3, and a tight correlation between the two datasets was observed, with slightly higher frequencies of Tim-3–expressing cells observed with polyclonal anti–Tim-3 antibody (Fig. S2 a). For the OPTIONS cohort, levels of Tim-3 expression were assessed using the monoclonal anti–Tim-3 antibody. Statistical analyses were performed using the Spearman's rank correlation test. Solid lines show the mean. Fig. S2 is available at
http://www.jem.org/cgi/content/full/jem.20081398/DC1
.
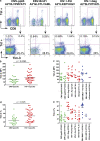
Figure 2.
Tim-3 is expressed at elevated levels on HIV-1–specific CD8+ T cells in progressive HIV-1 infection. PBMC from HLA-A*0201+, HLA-B*0702+, and HLA-B*0801+ chronically HIV-1–infected individuals from the CIRC cohort were stained with matched HLA pentamers presenting CMV, EBV, influenza, and HIV-1 epitopes, and with anti–Tim-3. (a) Shown are representative flow cytometry data from one HIV-1–infected chronic progressor using HLA-A*0201 pentamers presenting the CMV-pp65 epitope NLVPMVATV, the EBV-Bmlf1 epitope GLCTLVAML, the HIV-1–Pol epitope ILKEPVHGV, and the HIV-1–Gag epitope SLYNTVATL. (b–e) Compiled Tim-3 expression data from chronic progressors (n = 41) is shown for pooled Tim-3 expression on HIV-1 (b and d) and CMV-specific CD8+ T cell responses from chronic progressors' individual epitope responses (c and e). Statistical analyses comparing pooled responses were performed using the Mann-Whitney test. Solid lines show the mean.
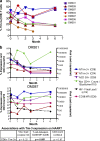
Figure 3.
Effect of HAART on levels of Tim-3 expression in chronic HIV-1 infection. Seven chronically HIV-1–infected individuals from the CIRC cohort were sampled at baseline and at 1, 2, 3, and 6 mo after initiation of HAART. (a and b) Shown are compiled Tim-3 expression on CD8+ T cells versus months after initiation of HAART (a) and Tim-3 and CD38 expression levels, as determined by flow cytometry, along with absolute CD4+ T cell count and HIV-1 viral load clinical data (b). The six individuals followed for 6 mo achieved undetectable viral loads (bDNA <50 copies/ml). The chart in b summarizes the p-values obtained from a mixed-effects longitudinal analysis studying associations between Tim-3 expression on CD8+ T cells with HIV-1 viral load, CD8+ T cell activation as measured by CD38 expression (MFI), and absolute CD4+ T cell count. The results of this analysis are further outlined in the text, and details are outlined in Materials and methods.
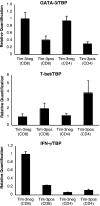
Figure 4.
Quantitative PCR analysis of T-bet and GATA-3 mRNA in Tim-3+ versus Tim-3− T cell subsets. PBMCs were stained with monoclonal antibodies to CD3, CD4, CD8, and Tim-3 and sorted into Tim-3+CD8+, Tim-3−CD8+, Tim-3+CD4+, and Tim-3−CD4+ subsets by flow cytometry. RNA was isolated and reverse transcribed. GATA-3, T-bet, TBP, and IFN-γ transcripts were quantified in triplicate by SYBR real-time PCR. Levels of GATA-3, T-bet, and IFN-γ expression were normalized to TBP. Shown are normalized quantifications expressed relative to the mean of Tim-3−CD8+ from a representative HIV-1–infected chronic progressor (CIRC cohort). Error bars represent SE.
Figure 5.
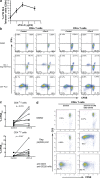
Tim-3–expressing CD8+ and CD4+ T cell populations are dysfunctional. (a and b) PBMCs derived from HIV-1–infected and –uninfected individuals were stimulated with pooled peptides or SEB superantigen for 6 h, stained for IFN-γ, TNF-α, and Tim-3 using a polyclonal Tim-3 antibody, and analyzed by multiparametric flow cytometry. (a) Representative flow cytometry plots showing cytokine responses to pooled Gag peptides and SEB in CD8+ and CD4+ T cells from a chronically HIV-1–infected individual (CIRC cohort). We used a three-tiered gating system for analyzing cytokine secretion by Tim-3–expressing cells, considering Tim-3−, Tim-3lo, and Tim-3hi populations. The division between Tim-3− and Tim-3lo populations was determined based on a control normal goat serum staining (as in Fig. 1 a). The division between Tim-3lo and Tim-3hi was set arbitrarily and then consistently applied to all samples (all run in parallel). (b) Compiled flow cytometry data from 10 chronically HIV-1–infected progressors (CIRC cohort). IFN-γ response percentage for each subset is normalized to the total number of cells within that population. (c) PBMCs from three chronic progressors were stained with an HLA-A*0201-SLYNTVATL pentamer and stimulated with SLYNTVATL peptide or DMSO control. Shown are cytokine production and Tim-3 expression as determined by flow cytometry in a representative subject. (d) CD8+ T cells were sorted into purified Tim-3hiCD8+ T cells and Tim-3−/loCD8+ T cell populations and labeled with CFSE from one of three representative HIV-1–infected individuals. These two populations were then cultured in the presence of anti-CD3 and anti-CD28 monoclonal antibodies for 5 d. Cells where then assessed for the diminution of CFSE as a readout of cell division. (e) PBMCs from HIV-1–uninfected (n = 5) and HIV-1–infected (n = 5) subjects were assessed for levels of intracellular Ki67 antigen expression. Shown are flow cytometry plots displaying Ki67 expression (x axis) by Tim-3 expression as determined with monoclonal anti–Tim-3 (y axis). (f) Shown is a histogram presenting Ki67 staining in comparison to isotype controls in Tim-3− and Tim-3+ populations of CD8+ T cells. (g) Shown is compiled Ki67 staining data from five HIV-1–infected subjects broken down into Tim-3+ and Tim-3− populations of CD8+ T cells. Solid lines show the mean.
Figure 6.
Addition of sTim-3 enhances the proliferation of HIV-1–specific T cells. (a) PBMC from a chronically HLA-A0201+ HIV-1–infected individual were stimulated with the SLYNTVATL peptide in the presence of 4, 2, or 1 μg/ml sTim-3, or a control (see Tim-3 expression methods), for 6 d. Cells were stained with HLA-A*0201 SLYNTVATL tetramer and mAbs to CD3, CD8, and anti–Tim-3. Percentages of viable tetramer+ CD8+ T cells were determined by flow cytometry. Each condition was tested in independent triplicate. Shown are mean percentages of tetramer+ CD8+ T cells on day 6 of stimulation. Error bars represent SE. (b and c) PBMCs from HIV-1–infected patients were stained with CFSE, and the effect of 2 μg/ml sTim-3 on cytokine production and proliferation of PBMCs in response to antigen was determined in these individuals over a 5-d stimulation assay. (b) Shown are representative data from one chronically HIV-1–infected individual on day 5 of culture, showing CFSE (x axis) by IFN-γ production (y axis) in CD8+ and CD4+ T cell populations in response to DMSO (top), pooled HIV-1–derived Gag/Nef peptides (middle) or CEF pooled peptides (bottom) in the presence or absence of either 2 μg/ml sTim-3 or an equal volume of expression control (see Materials and methods). CFSE becomes diluted in cells undergoing proliferation. Thus, cells in the two left quadrants of each plot have proliferated. (c) Shown are summary data for the effect of 2 μg/ml sTim-3 on proliferation in response to Gag from seven chronically HIV-1–infected individuals. P-values were determined by the Wilcoxon matched pairs test. (d) PBMC from an individual with chronic progressive HIV-1 infection were stained with CFSE and stimulated for 7 d with DMSO and pooled HIV-1–Gag peptides or with anti-CD3 and anti-CD28. For each stimulation, the effect of 10 μg/ml of anti–Tim-3 mAb 2E2 was compared with 10 μg/ml of mouse IgG1 isotype control. Shown are flow cytometry plots showing CD3 by CFSE, where diminution of CFSE is indicative of proliferated cells.
Figure 7.
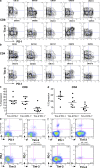
Tim-3 and PD-1 are independent surface markers with divergent expression. (a–d) PBMCs were labeled with fluorochrome-conjugated mAbs to CD3, CD8, CD28, PD-1, and Tim-3. (a and b) Shown are flow cytometry plots from 10 chronically HIV-1–infected individuals (CIRC cohort), gated on either the CD3+CD8+ population (a) or the CD3+CD4+ population (b). (c and d) Shown is summary data of the flow cytometry plots displayed in a and b. (e and f) Shown are flow cytometry data analyzing coexpression of Tim-3 and PD-1 on HIV-1–specific CD8+ T cells in comparison with bulk CD8+ T cells in CD8+-enriched PBMC from individuals with chronic progressive HIV-1 infection. Solid lines show the mean. (e) HIV-1–Pol-ILKEPVHGV-specific CD8+ T cells were identified using HLA-A02 tetramers. (f) HIV-1–Nef-TGPGVRYPL-specific CD8+ T cells were identified using HLA-B07 tetramers.
Figure 8.
Tim-3–expressing CD8+ T cells are present in diverse phenotypic profiles. (a) PBMCs from HIV-1–uninfected (n = 3) and chronically HIV-1–infected (n = 3) individuals were labeled with fluorochrome-conjugated mAbs to CD3, CD8, CD4, CD25, and Tim-3. Shown are flow cytometry plots gated on the CD3+CD4+ population or the CD3+CD8+ population from two representative individuals. (b) PBMCs from a chronic progressor were labeled with fluorochrome-conjugated mAbs against Tim-3, CD3, CD8, CD28, CD27, CD45RA, CCR7, and CD57, as well as with a dead cell–discriminating marker. Gating was first performed to include only the viable CD3+CD8+ population in subsequent analyses. Shown are phenotypic representations of the Tim-3hi population (blue) versus Tim-3lo population (red). (c) Summary data showing phenotypic profiling for seven chronically HIV-1–infected individuals. Gating for maturation/differentiation markers was determined based on fluorescence minus one controls, and results were analyzed using SPICE software. Shown are the frequencies of populations with the corresponding combination of phenotypic markers, with each individual represented by a single bar.
Figure 9.
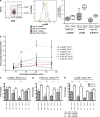
Tim-3–expressing cells exhibit impaired Stat-5, p35, and Erk1/2 signaling in response to stimuli. Phosphorylation status of Stat5, p38, and Erk1/2 were analyzed by flow cytometry in Tim-3hi versus Tim-3−/lo CD8+ T cells from three HIV-1–infected subjects. Whole PBMCs were surface stained on ice, stimulated with either rIL-2 for 45 min or P+I for 15 min, and phosphorylation of Stat5 or Erk1/2 and p38, respectively, was analyzed with phosphospecific antibodies in CD3+CD8+ T cells and based on their Tim-3 expression. (a) Shown is a representative flow cytometry gating of Tim-3hi and Tim-3−/lo CD8+ PBMCs evaluating the fold change in p38 phosphorylation after 15 min of stimulation with P+I and summary of data from three chronically HIV-1–infected individuals, each analyzed in triplicates, with fold changes in phosphorylation of stimulated/unstimulated cells. (b) Shown is a representative time course depicting fold change in phosphorylation (stimulated/unstimulated cells) after 15, 30, and 45 min of stimulation. (c–e) Compiled data for Stat5 (c), Erk-1/2 (d), and p38 (e), showing differential levels of change in target phosphorylation (measured by change in mean fluorescence intensity) in Tim-3+ versus Tim-3− cells within each of the following CD3+CD8+ T cell subpopulations: naive (CD27+CD45RA+), memory (CD27+CD45RA−), effector memory (CD27−CD45RA−), or effector (CD27−CD45RA+). Statistical analyses were performed using a nonparametric two-tailed Mann Whitney U test. (*, P ≤ 0.05; **, P < 0.01; ***, P < 0.001) using Prism GraphPad. Error bars represent SE.
Comment in
- TIMs: central regulators of immune responses.
Hafler DA, Kuchroo V. Hafler DA, et al. J Exp Med. 2008 Nov 24;205(12):2699-701. doi: 10.1084/jem.20082429. Epub 2008 Nov 17. J Exp Med. 2008. PMID: 19015312 Free PMC article.
Similar articles
- HCV-specific T cells in HCV/HIV co-infection show elevated frequencies of dual Tim-3/PD-1 expression that correlate with liver disease progression.
Vali B, Jones RB, Sakhdari A, Sheth PM, Clayton K, Yue FY, Gyenes G, Wong D, Klein MB, Saeed S, Benko E, Kovacs C, Kaul R, Ostrowski MA. Vali B, et al. Eur J Immunol. 2010 Sep;40(9):2493-505. doi: 10.1002/eji.201040340. Eur J Immunol. 2010. PMID: 20623550 - Tim-3 negatively regulates cytotoxicity in exhausted CD8+ T cells in HIV infection.
Sakhdari A, Mujib S, Vali B, Yue FY, MacParland S, Clayton K, Jones RB, Liu J, Lee EY, Benko E, Kovacs C, Gommerman J, Kaul R, Ostrowski MA. Sakhdari A, et al. PLoS One. 2012;7(7):e40146. doi: 10.1371/journal.pone.0040146. Epub 2012 Jul 5. PLoS One. 2012. PMID: 22792231 Free PMC article. - Antigen-independent induction of Tim-3 expression on human T cells by the common γ-chain cytokines IL-2, IL-7, IL-15, and IL-21 is associated with proliferation and is dependent on the phosphoinositide 3-kinase pathway.
Mujib S, Jones RB, Lo C, Aidarus N, Clayton K, Sakhdari A, Benko E, Kovacs C, Ostrowski MA. Mujib S, et al. J Immunol. 2012 Apr 15;188(8):3745-56. doi: 10.4049/jimmunol.1102609. Epub 2012 Mar 14. J Immunol. 2012. PMID: 22422881 - Revisiting immune exhaustion during HIV infection.
Khaitan A, Unutmaz D. Khaitan A, et al. Curr HIV/AIDS Rep. 2011 Mar;8(1):4-11. doi: 10.1007/s11904-010-0066-0. Curr HIV/AIDS Rep. 2011. PMID: 21188556 Free PMC article. Review. - Too much of a good thing? Tim-3 and TCR signaling in T cell exhaustion.
Ferris RL, Lu B, Kane LP. Ferris RL, et al. J Immunol. 2014 Aug 15;193(4):1525-30. doi: 10.4049/jimmunol.1400557. J Immunol. 2014. PMID: 25086175 Free PMC article. Review.
Cited by
- Thinking inside the box: how T cell inhibitory receptors signal.
Haining WN. Haining WN. Nat Med. 2012 Sep;18(9):1338-9. doi: 10.1038/nm.2921. Nat Med. 2012. PMID: 22961161 No abstract available. - PD-1 and Tim-3 Pathways Regulate CD8+ T Cells Function in Atherosclerosis.
Qiu MK, Wang SC, Dai YX, Wang SQ, Ou JM, Quan ZW. Qiu MK, et al. PLoS One. 2015 Jun 2;10(6):e0128523. doi: 10.1371/journal.pone.0128523. eCollection 2015. PLoS One. 2015. PMID: 26035207 Free PMC article. - Galectin-9 ameliorates clinical severity of MRL/lpr lupus-prone mice by inducing plasma cell apoptosis independently of Tim-3.
Moritoki M, Kadowaki T, Niki T, Nakano D, Soma G, Mori H, Kobara H, Masaki T, Kohno M, Hirashima M. Moritoki M, et al. PLoS One. 2013 Apr 9;8(4):e60807. doi: 10.1371/journal.pone.0060807. Print 2013. PLoS One. 2013. PMID: 23585851 Free PMC article. - Tim-3 expression on PD-1+ HCV-specific human CTLs is associated with viral persistence, and its blockade restores hepatocyte-directed in vitro cytotoxicity.
McMahan RH, Golden-Mason L, Nishimura MI, McMahon BJ, Kemper M, Allen TM, Gretch DR, Rosen HR. McMahan RH, et al. J Clin Invest. 2010 Dec;120(12):4546-57. doi: 10.1172/JCI43127. Epub 2010 Nov 15. J Clin Invest. 2010. PMID: 21084749 Free PMC article. - Soluble T-Cell Immunoglobulin Mucin Domain-3 Is Associated With Hepatitis C Virus Coinfection and Low-Grade Inflammation During Chronic Human Immunodeficiency Virus Infection.
Hoel H, Ueland T, Hove-Skovsgaard M, Hartling HJ, Gelpi M, Benfield T, Ullum H, Michelsen AE, Aukrust P, Nielsen SD, Trøseid M. Hoel H, et al. Open Forum Infect Dis. 2020 Jan 29;7(2):ofaa033. doi: 10.1093/ofid/ofaa033. eCollection 2020 Feb. Open Forum Infect Dis. 2020. PMID: 32055642 Free PMC article.
References
- Schmitz, J.E., M.J. Kuroda, S. Santra, V.G. Sasseville, M.A. Simon, M.A. Lifton, P. Racz, K. Tenner-Racz, M. Dalesandro, B.J. Scallon, et al. 1999. Control of viremia in simian immunodeficiency virus infection by CD8+ lymphocytes. Science. 283:857–860. - PubMed
- Metzner, K.J., X. Jin, F.V. Lee, A. Gettie, D.E. Bauer, M. Di Mascio, A.S. Perelson, P.A. Marx, D.D. Ho, L.G. Kostrikis, and R.I. Connor. 2000. Effects of in vivo CD8+ T cell depletion on virus replication in rhesus macaques immunized with a live, attenuated simian immunodeficiency virus vaccine. J. Exp. Med. 191:1921–1931. - PMC - PubMed
- Ogg, G.S., X. Jin, S. Bonhoeffer, P.R. Dunbar, M.A. Nowak, S. Monard, J.P. Segal, Y. Cao, S.L. Rowland-Jones, V. Cerundolo, et al. 1998. Quantitation of HIV-1-specific cytotoxic T lymphocytes and plasma load of viral RNA. Science. 279:2103–2106. - PubMed
- Rosenberg, E.S., J.M. Billingsley, A.M. Caliendo, S.L. Boswell, P.E. Sax, S.A. Kalams, and B.D. Walker. 1997. Vigorous HIV-1-specific CD4+ T cell responses associated with control of viremia. Science. 278:1447–1450. - PubMed
Publication types
MeSH terms
Substances
Grants and funding
- R21 AI060379/AI/NIAID NIH HHS/United States
- AI68498/AI/NIAID NIH HHS/United States
- DP1 OD000329/OD/NIH HHS/United States
- AI64520/AI/NIAID NIH HHS/United States
- R01 AI060379/AI/NIAID NIH HHS/United States
- DPI OD00329/OD/NIH HHS/United States
- R01 AI068498/AI/NIAID NIH HHS/United States
- K01 AI066917/AI/NIAID NIH HHS/United States
- P01 AI064520/AI/NIAID NIH HHS/United States
- AI066917/AI/NIAID NIH HHS/United States
- AI60379/AI/NIAID NIH HHS/United States
- P30 AI027763/AI/NIAID NIH HHS/United States
- U01 AI43641/AI/NIAID NIH HHS/United States
LinkOut - more resources
Full Text Sources
Other Literature Sources
Medical
Molecular Biology Databases
Research Materials
Miscellaneous
