Distinct thresholds govern Myc's biological output in vivo - PubMed (original) (raw)
Distinct thresholds govern Myc's biological output in vivo
Daniel J Murphy et al. Cancer Cell. 2008.
Abstract
Deregulated Myc triggers a variety of intrinsic tumor suppressor programs that serve to restrain Myc's oncogenic potential. Since Myc activity is also required for normal cell proliferation, activation of intrinsic tumor suppression must be triggered only when Myc signaling is oncogenic. However, how cells discriminate between normal and oncogenic Myc is unknown. Here we show that distinct threshold levels of Myc govern its output in vivo: low levels of deregulated Myc are competent to drive ectopic proliferation of somatic cells and oncogenesis, but activation of the apoptotic and ARF/p53 intrinsic tumor surveillance pathways requires Myc overexpression. The requirement to keep activated oncogenes at a low level to avoid engaging tumor suppression is likely an important selective pressure governing the early stages of tumor microevolution.
Figures
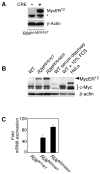
Figure 1. Characteristics of MycERT2 expression in R26lsl-MER MEFs
A) _Rosa26_-driven MycERT2 expression in R26lsl-MER MEFs is dependent upon Cre recombinase-dependent and is transgene dose-dependent. R26lsl-MER/WT MEFs were infected with retrovirus driving Cre recombinase (+) or control vector (−) and selected with puromycin for 3 days. Western blotting of whole cell lysates with anti-human ERαantibody reveals expression of the predicted 92Kda MycERT2 fusion protein. The asterisk denotes a non-specific band. B) Simultaneous comparison of levels of endogenous Myc and MycERT2 in wt, R26MER/wt and R26MER/MER MEFs. MEFs were isolated from embryos of each genotype and cultured in complete growth medium/10% FBS. Equal numbers of cell equivalents from each lysate were western blotted with SC42 anti-Myc antibody, detecting an epitope common to endogenous Myc and MycERT2. Extracts from serum-deprived wt MEFs and from wt MEFs 2 hrs after addition of fresh medium were probed alongside, together with an equivalent number of HeLa cells, which over express c-Myc (~30,000 molecules per cell) for comparison (Moore et al., 1987). C) Dose dependent expression of MycERT2 mRNA driven from the Rosa26 locus. Q-PCR quantitation (mean + SEM) of MycERT2 mRNA isolated from in wt, R26MER/WT and R26MER/MER MEFs, all normalized to GUS (n=3).
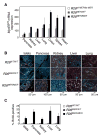
Figure 2. Dose-dependent induction of proliferation by _Rosa26_-driven MycERT2 in Vivo
A) Q-PCR analysis of MycERT2 mRNA levels (mean + SEM) in selected organs from untreated adult R26lsl-MER/lsl-MER (white bars), R26MER/WT (grey bars) and R26MER/MER (black bars) mice, normalized to GUS (n=3). B) Representative images of 2-colour immunofluorescent detection of BrdU/IdU incorporation, indicating instances of S-phase progression in mice treated daily with tamoxifen for 6 days. Yellow-Orange: BrdU incorporation (S phase on day 3); Green: IdU incorporation (S phase on day 6). C) Quantification (mean + SEM) of BrdU incorporation in tissues of control, R26MER/wt and R26MER/MER mice at day 6.
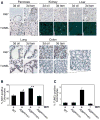
Figure 3. Widespread Myc-induced ectopic proliferation occurs without apoptosis in R26MER/MER mice
A) Organs from adult R26MER/MER mice treated for 3 days with tamoxifen (tam) (n=7) or oil carrier (n=6), assessed for proliferation (Ki67 staining), and apoptosis (TUNEL assay). Activation of MycERT2 drives abundant ectopic cell cycle entry in multiple tissues (exocrine and endocrine pancreas, kidney, liver, lung and colon are presented). However, with the exception of the colon (inset), no tissue exhibited concomitant Myc-induced apoptosis. Scale bars = 25 μm. B) Quantification (mean + SEM) of Ki67 staining in colon sections from tamoxifen-treated R26WT/WT (n=4), R26MER/WT (n=6), R26MER/MER mice (n=3), and from R26MER/MER mice treated with carrier (n=3). T Test analysis indicates that the increase in proliferation from R26WT/WT to R26MER/WT is significant (* P = 0.001) as is the increase from R26MER/WT to R26MER/MER (** P = 0.004). C) Quantification (mean + SEM) of TUNEL positive cells in sections of colonic epithelium from same mice as B).
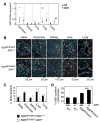
Figure 4. Activation of MycERT2 in most tissues of R26MER/MER does not induce the p19_ARF_ tumor suppressor
A) Q-PCR analysis for expression of ARF mRNA in organs from adult R26MER/MER mice treated for 3 days with tamoxifen (n=7) or oil carrier (n=7), normalized to GUS. No ARF is induced by MycERT2 activation in any tested tissue except for colonic epithelium, where it is statistically significant (* P value = 0.004). B) Representative 2-colour immunoflourescence images of tissues from R26MER/MER;ARF+/+ (n=7) and R26MER/MER;ARF_−/_− (n=4) mice, injected daily with tamoxifen for 6 days. Mice were systemically pulsed with BrdU on day 2 and IdU on day 6, as per Figure 2, to identify cells in S phase at day 2 (Yellow-Orange) and day 6 (green). C) Quantification (mean + SEM) of BrdU incorporation on day 6. Note that the data for ARF+/+ are the same as those presented in Figures 2C. D) Quantification (mean + SEM) of Ki67 staining of colon sections from the indicated mice treated for 3 days with tamoxifen. Data for ARF+/+ samples are the same as those presented in Figure 3B. R26WT/WT;ARF_−/_− (n=3); R26MER/MER;ARF_−/_− (n=2).
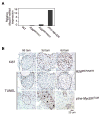
Figure 5. Induction of apoptosis requires higher levels of deregulated Myc than induction of ectopic proliferation
A) Q-PCR analysis of MycER mRNA expression in islets isolated from disaggregated pancreata of untreated designated mice, pooled according to genotype (n>2 per cohort). Expression was normalized to GUS and results are expressed relative to MycERT2 mRNA in R26MER/MER islets. B) TUNEL staining of pancreatic islets from R26MER/MER mice, treated with tamoxifen for 3 (n=7) or 6 (n=6) days (center panels), with matched samples from similarly treated pIns-MycERTAM mice (lower panels). Ki67 staining of adjacent sections from R26MER/MER pancreata (upper panels) demonstrates tamoxifen-induced functionality of _Rosa26_-driven MycERT2 protein.
Figure 6. Sub-apoptotic Myc synergises with sub-apoptotic doxorubicin to induce apoptosis in multiple tissues
A) TUNEL staining of pancreatic islets (panels 1, 2), liver (panels 3, 4), and colon (panels 5, 6) from R26WT/WT (n=2) and R26MER/MER (n=4) mice treated for 3 days with tamoxifen and overnight with 10 mg/kg doxorubicin. B) Quantification (mean + SEM) of TUNEL staining in sections from pancreas (islets), liver and colon from the above mice treated with tamoxifen and/or doxorubicin. (n=2–4 mice per cohort).
Figure 7. Low level deregulated Myc is tumorigenic in vivo
A) Representative images of H & E-stained lungs from tamoxifen treated, Ad-Cre infected R26lsl-MER/lsl-MER mice showing multiple pre-neoplastic pulmonary lesions. Panels 1, 2: Localized epithelial dysplasia (ed) evident in airway epithelium (panel 1) and bronchioalveolar junctions (panel 2) after 3 weeks of sustained MycERT2 activation. Compare with normal bronchiolar epithelium (n). Scale bars=20 μm. Panels 3, 4: Micro-papillary invaginations (panel 3) and atypical Clara cell proliferation characterized by vertical stacking of bronchiolar epithelial cells with apical nuclei (panel 4) present after 6 weeks of sustained MycERT2 activation. Scale bars=40 μm. B) H & E stained lungs from Ad-Cre infected LSL-K-RasG12D;R26lsl-MER/lsl-MER mice treated with oil carrier (n=3, panels 1–4) or tamoxifen (n=6, panels 5–12) for 6 weeks. Panels 1, 2, 5 & 6: Size comparison between tumors driven by K-RasG12D alone (1, 2) and K-RasG12D/MycERT2 combined (5, 6). Scale bars=0.4 □m (1, 5) and 100 μm (2, 6). The numbered rectangular regions within panels 1, 3, 5, 6, 7 and 9 are shown enlarged in panels 2, 4, 6, 11, 8, and 10 respectively. Panels 3, 4, 7 & 8: Micropapillary formation along the bronchioles driven by K-RasG12D alone (3, 4) and K-RasG12D/MycERT2 combined (7, 8). The arrowhead points to a mitotic figure in panel 8. Scale bars=50μm (3, 7) and 20 μm (4, 8). Panels 9–11: Progression to carcinoma observed after 6 weeks of combined KrasG12D/MycERT2 driven oncogenesis. Scale bars=100 μm (9) and 20 μm (10, 11, 12). Panel 10: Nests of solid tumor (st) and isolated tumor cells surrounded by desmoplastic stroma (ds). Panels 11, 12: Mitotic figures (arrowheads) present in combined K-RasG12D/MycERT2-driven papillary adenoma (pa), adenocarcinoma (ac; 11) and acinar adenocarcinoma.
Comment in
- Ratcheting Myc.
Freie BW, Eisenman RN. Freie BW, et al. Cancer Cell. 2008 Dec 9;14(6):425-6. doi: 10.1016/j.ccr.2008.11.008. Cancer Cell. 2008. PMID: 19061831 Free PMC article.
References
- Askew DS, Ashmun RA, Simmons BC, Cleveland JL. Constitutive c-myc expression in an IL-3-dependent myeloid cell line suppresses cell cycle arrest and accelerates apoptosis. Oncogene. 1991;6:1915–1922. - PubMed
- Bertwistle D, Sherr CJ. Regulation of the ARF tumor suppressor in Eμ-Myc transgenic mice: longitudinal study of Myc-induced lymphomagenesis. Blood. 2007;109:792–794. - PubMed
- Bertwistle D, Zindy F, Sherr CJ, Roussel MF. Monoclonal antibodies to the mouse p19(Arf) tumor suppressor protein. Hybridomics. 2004;23:293–300. - PubMed
- Bissonnette R, Echeverri F, Mahboubi A, Green D. Apoptotic cell death induced by c-myc is inhibited by bcl-2. Nature. 1992;359:552–554. - PubMed
- Burns KA, Kuan CY. Low doses of bromo- and iododeoxyuridine produce near-saturation labeling of adult proliferative populations in the dentate gyrus. Eur J Neurosci. 2005;21:803–807. - PubMed
Publication types
MeSH terms
Substances
Grants and funding
- R01 CA106526/CA/NCI NIH HHS/United States
- F32 CA099363/CA/NCI NIH HHS/United States
- CA099363/CA/NCI NIH HHS/United States
- R01 CA098018/CA/NCI NIH HHS/United States
- R01-CA106526/CA/NCI NIH HHS/United States
LinkOut - more resources
Full Text Sources
Other Literature Sources
Molecular Biology Databases
Research Materials
Miscellaneous
