Correcting estimators of theta and Tajima's D for ascertainment biases caused by the single-nucleotide polymorphism discovery process - PubMed (original) (raw)
Correcting estimators of theta and Tajima's D for ascertainment biases caused by the single-nucleotide polymorphism discovery process
Anna Ramírez-Soriano et al. Genetics. 2009 Feb.
Abstract
Most single-nucleotide polymorphism (SNP) data suffer from an ascertainment bias caused by the process of SNP discovery followed by SNP genotyping. The final genotyped data are biased toward an excess of common alleles compared to directly sequenced data, making standard genetic methods of analysis inapplicable to this type of data. We here derive corrected estimators of the fundamental population genetic parameter = 4N(e)mu (N(e), effective population size; mu, mutation rate) on the basis of the average number of pairwise differences and on the basis of the number of segregating sites. We also derive the variances and covariances of these estimators and provide a corrected version of Tajima's D statistic. We reanalyze a human genomewide SNP data set and find substantial differences in the results with or without ascertainment bias correction.
Figures
Figure 1.—
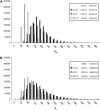
The distribution of the estimates of θ assuming nonascertained data (no asc), ascertained data with correction (asc | c), and ascertained data without correction (asc | nc). The mean and the variance of each set of data are shown in the insets. Simulations were performed for n = 50, d = 5, θ = 150, and 1,000,000 replicates. (A) Watterson's estimator. (B) Tajima's estimator.
Figure 2.—
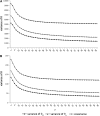
The variance of Watterson's estimator of θ () and Tajima's estimator of θ (
) and the covariance as a function of d calculated using estimated values of θ and θ2 for a sample of size n = 100. We performed 10,000 replicates. (A) θ = 150. (B) θ = 22.33.
Figure 3.—
The distribution of Tajima's D for data without ascertainment bias and without correction (no asc), for ascertained data with correction (asc | c), and for ascertained data without correction (asc | nc). The mean and the variance among estimates are shown in the inset. A value of θ = 150 was used, with n = 50, d = 5, and 1,000,000 replicates were performed.
Figure 4.—
The distribution of the ascertainment bias corrected Tajima's D on chromosome 1 in the human genome based on the Perlegen data. The genes with the most extreme D values are also indicated.
Figure 5.—
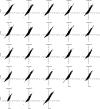
Correlation of Tajima's D results from Perlegen data with and without correction for all chromosomes.
Similar articles
- Correcting for ascertainment biases when analyzing SNP data: applications to the estimation of linkage disequilibrium.
Nielsen R, Signorovitch J. Nielsen R, et al. Theor Popul Biol. 2003 May;63(3):245-55. doi: 10.1016/s0040-5809(03)00005-4. Theor Popul Biol. 2003. PMID: 12689795 - Calculation of Tajima's D and other neutrality test statistics from low depth next-generation sequencing data.
Korneliussen TS, Moltke I, Albrechtsen A, Nielsen R. Korneliussen TS, et al. BMC Bioinformatics. 2013 Oct 2;14:289. doi: 10.1186/1471-2105-14-289. BMC Bioinformatics. 2013. PMID: 24088262 Free PMC article. - Ascertainment bias and the pattern of nucleotide diversity at the human ALDH2 locus in a Japanese population.
Brown BT, Woerner A, Wilder JA. Brown BT, et al. J Mol Evol. 2007 Mar;64(3):375-85. doi: 10.1007/s00239-006-0149-0. Epub 2007 Jan 16. J Mol Evol. 2007. PMID: 17225965 - SNP ascertainment bias in population genetic analyses: why it is important, and how to correct it.
Lachance J, Tishkoff SA. Lachance J, et al. Bioessays. 2013 Sep;35(9):780-6. doi: 10.1002/bies.201300014. Epub 2013 Jul 9. Bioessays. 2013. PMID: 23836388 Free PMC article. Review. - Population genetic analysis of ascertained SNP data.
Nielsen R. Nielsen R. Hum Genomics. 2004 Mar;1(3):218-24. doi: 10.1186/1479-7364-1-3-218. Hum Genomics. 2004. PMID: 15588481 Free PMC article. Review.
Cited by
- Molecular marker development and genetic diversity exploration in Medicago polymorpha.
Ren H, Wei Z, Zhou B, Chen X, Gao Q, Zhang Z. Ren H, et al. PeerJ. 2023 Jan 16;11:e14698. doi: 10.7717/peerj.14698. eCollection 2023. PeerJ. 2023. PMID: 36684677 Free PMC article. - Diversity and evolution of 11 innate immune genes in Bos taurus taurus and Bos taurus indicus cattle.
Seabury CM, Seabury PM, Decker JE, Schnabel RD, Taylor JF, Womack JE. Seabury CM, et al. Proc Natl Acad Sci U S A. 2010 Jan 5;107(1):151-6. doi: 10.1073/pnas.0913006107. Epub 2009 Dec 14. Proc Natl Acad Sci U S A. 2010. PMID: 20018671 Free PMC article. - Sequencing and analysis of an Irish human genome.
Tong P, Prendergast JG, Lohan AJ, Farrington SM, Cronin S, Friel N, Bradley DG, Hardiman O, Evans A, Wilson JF, Loftus B. Tong P, et al. Genome Biol. 2010;11(9):R91. doi: 10.1186/gb-2010-11-9-r91. Epub 2010 Sep 7. Genome Biol. 2010. PMID: 20822512 Free PMC article. - Widespread genomic signatures of natural selection in hominid evolution.
McVicker G, Gordon D, Davis C, Green P. McVicker G, et al. PLoS Genet. 2009 May;5(5):e1000471. doi: 10.1371/journal.pgen.1000471. Epub 2009 May 8. PLoS Genet. 2009. PMID: 19424416 Free PMC article. - A bioinformatics workflow for detecting signatures of selection in genomic data.
Cadzow M, Boocock J, Nguyen HT, Wilcox P, Merriman TR, Black MA. Cadzow M, et al. Front Genet. 2014 Aug 26;5:293. doi: 10.3389/fgene.2014.00293. eCollection 2014. Front Genet. 2014. PMID: 25206364 Free PMC article.
References
- Altshuler, D., V. J. Pollara, C. R. Cowles, W. J. Van Etten, J. Baldwin et al., 2000. An SNP map of the human genome generated by reduced representation shotgun sequencing. Nature 407 513–516. - PubMed
- Bamshad, M., and S. P. Wooding, 2003. Signatures of natural selection in the human genome. Nat. Rev. Genet. 4 99–111. - PubMed
- Carlson, C. S., M. A. Eberle, L. Kruglyak and D. A. Nickerson, 2004. Mapping complex disease loci in whole-genome association studies. Nature 429 446–452. - PubMed
- Carlson, C. S., J. D. Smith, I. B. Stanaway, M. J. Rieder and D. A. Nickerson, 2006. Direct detection of null alleles in SNP genotyping data. Hum. Mol. Genet. 15 1931–1937. - PubMed
Publication types
MeSH terms
LinkOut - more resources
Full Text Sources
Research Materials


