Differential trafficking of AMPA and NMDA receptors by SAP102 and PSD-95 underlies synapse development - PubMed (original) (raw)
Differential trafficking of AMPA and NMDA receptors by SAP102 and PSD-95 underlies synapse development
G M Elias et al. Proc Natl Acad Sci U S A. 2008.
Abstract
The development of glutamatergic synapses involves changes in the number and type of receptors present at the postsynaptic density. To elucidate molecular mechanisms underlying these changes, we combine in utero electroporation of constructs that alter the molecular composition of developing synapses with dual whole-cell electrophysiology to examine synaptic transmission during two distinct developmental stages. We find that SAP102 mediates synaptic trafficking of AMPA and NMDA receptors during synaptogenesis. Surprisingly, after synaptogenesis, PSD-95 assumes the functions of SAP102 and is necessary for two aspects of synapse maturation: the developmental increase in AMPA receptor transmission and replacement of NR2B-NMDARs with NR2A-NMDARs. In PSD-95/PSD-93 double-KO mice, the maturational replacement of NR2B- with NR2A-NMDARs fails to occur, and PSD-95 expression fully rescues this deficit. This study demonstrates that SAP102 and PSD-95 regulate the synaptic trafficking of distinct glutamate receptor subtypes at different developmental stages, thereby playing necessary roles in excitatory synapse development.
Conflict of interest statement
The authors declare no conflict of interest.
Figures
Fig. 1.
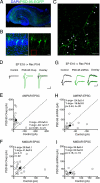
PSD-95 is not necessary for synaptic trafficking of glutamate receptors during synaptogenesis in vivo. (A) Confocal image of hippocampal coronal slice at P7 after in utero electroporation of PSD-95–EGFP (green) at E16 (nuclear DAPI in blue). (B) (Left) CA1 region shows mosaic distribution of PSD-95 overexpressing (EGFP+/DAPI+) and untransfected neurons (EGFP−/DAPI+). (Right) Apical and basal dendritic arborizations of PSD-95–EGFP neurons. (C) Boxed area in B shows PSD-95–EGFP clusters (white arrowheads) in dendrites and spines. (D) Evoked EPSCs recorded simultaneously from an untransfected control neuron and a PSD-95 overexpressing (PSD-95 Ovxp) neighbor. (E, F, H, and I) For all EPSC scatter plots in this and subsequent figures, open and filled circles represent amplitudes for individual pairs and mean ± SEM, respectively. Distributions show a significant increase in AMPAR EPSC amplitudes (E) but not in NMDAR EPSC amplitudes (F). (G) Evoked EPSCs from an untransfected neuron and an adjacent neuron expressing PSD-95 shRNA. (B, H) Distributions of EPSCs show no effect of PSD-95 shRNA on AMPAR (H) or NMDAR (I) EPSC amplitudes. (Scale bars: A–C = 500, 25, and 10 μm, respectively; D = 50 pA, 25 ms; G = 10 pA, 25 ms.)
Fig. 2.
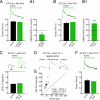
SAP102 mediates NMDA receptor synaptic trafficking during synaptogenesis in vivo. (A) Representative NMDAR EPSCs from untransfected and adjacent SAP102 overexpressing (SAP102 Ovxp) neurons from E16 to P6–P8. (B) SAP102 overexpression significantly increases NMDAR EPSC amplitudes relative to untransfected neurons. (D) Representative EPSCs in untransfected and neighboring neuron expressing SAP102 shRNA. (E) shRNA-mediated knockdown of SAP102 significantly reduces NMDAR EPSC amplitudes. Neither SAP102 overexpression (C: Top, sample traces; Bottom, summary bar graph) nor SAP102 knockdown (F: Top, sample traces; Bottom, summary bar graph) significantly affects the PPR [(C, control: 1.5 ± 0.19, n = 7; SAP102 Ovxp: 1.6 ± 0.16, n = 7; P = 0.82); (F, control: 1.5 ± 0.24, n = 8; SAP102 shRNA: 1.7 ± 0.16, n = 15; P = 0.89)]. (Error bars = SEM.) (G) Confocal image of transfected (SAP102 shRNA neuron, green) and untransfected neighbor (control, red) filled with Alexa Fluors. (H) High magnification of boxed area in G shows spines in both cells (white arrowheads). (I) Pair-wise comparison of the number of spines per unit length of apical dendrite between SAP102 shRNA-expressing and untransfected control neurons shows no significant difference in spine density. Open and filled circles represent spine densities for single pairs and the mean ± SEM, respectively. (Scale bars: A = 25 pA, 25 ms; D = 20 pA, 25 ms.)
Fig. 3.
SAP102 regulates synaptic insertion of NR2B-NMDARs and NR2A-NMDARs. (A) (Top) Peak-scaled NMDAR EPSCs from SAP102 shRNA-expressing and slice-matched untransfected neurons. (Bottom) No differences in NMDAR EPSC decay times (control: 0.36 ± 0.02 s, n = 17; SAP102 shRNA: 0.35 ± 0.02 s, n = 19; P = 0.66). (A1) SAP102 knockdown reduces NMDAR EPSC amplitudes relative to untransfected neurons (100% black dashed line) (n = 10; **P < 0.01). (B) (Top) Peak-scaled NMDAR EPSCs from SAP102 overexpressing (SAP102 Ovxp) and slice-matched untransfected neurons. (Bottom) No significant difference in NMDAR EPSC decay time (control: 0.33 ± 0.02 s, n = 8; SAP102 Ovxp: 0.35 ± 0.01 s, n = 10; P = 0.74). (B1) SAP102 overexpression increases NMDAR EPSC amplitudes relative to untransfected neurons (100% dashed line) (n = 21; **P < 0.001) (data replotted from Fig. 2_A_). (C) (Top) Traces of NMDAR EPSCs before and 20–25 min after ifenprodil application (arrow). (Bottom) Percent of NMDAR EPSC remaining 20–25 min after ifenprodil application relative to baseline (control: 42.95 ± 2.9%, n = 6; SAP102 Ovxp: 45.9 ± 4.4%, n = 6; P = 0.38). (D) NMDAR EPSCs in control and neighboring neurons overexpressing SAP102 from E16 to P15–P17. (E) Scatter plot shows significantly increased NMDAR EPSC peak amplitudes in SAP102 overexpressing neurons. (F) (Top) Peak-scaled NMDAR EPSCs from a SAP102 overexpressing neuron and a slice-matched untransfected neuron. (Bottom) Summary shows no significant difference in NMDAR EPSC decay times (control: 0.24 ± 0.02 s, n = 11; SAP102 Ovxp: 0.23 ± 0.01 s, n = 11; P = 0.41). (Scale bars: A, B, and F = 200 ms; C and D = 10 pA, 25 ms and 25 pA, 25 ms, respectively.)
Fig. 4.
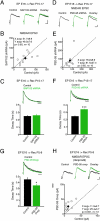
PSD-95, but not SAP102, is necessary for synaptic maturation of NMDAR-mediated synaptic transmission in vivo. (A) NMDAR EPSCs in a control and a neighboring neuron expressing SAP102 shRNA. (B) Plot shows no significant difference in NMDAR EPSC amplitudes between conditions. (C) (Top) Peak-scaled NMDAR EPSCs recorded from a SAP102 shRNA-expressing neuron and a slice-matched untransfected control. (Bottom) Graph shows no significant difference in NMDAR EPSC decay times (control: 0.26 ± 0.02 s, n = 11; SAP102 shRNA: 0.25 ± 0.01 s, n = 10; P = 0.70). (D) NMDAR EPSCs recorded simultaneously from untransfected control and neurons expressing PSD-95 shRNA. (E) Plot of NMDAR EPSC peak amplitudes. (F) (Top) Peak-scaled NMDAR EPSCs recorded from a PSD-95 shRNA-expressing neuron and a slice-matched control. (Bottom) Graph shows a significant increase in NMDAR EPSC decay time in PSD-95 shRNA-expressing neurons (control: 0.25 ± 0.01 s, n = 16; PSD-95 shRNA: 0.34 ± 0.01 s, n = 13; ***P < 0.001). (G) (Top) Peak-scaled NMDAR EPSCs recorded from a PSD-95 overexpressing neuron (PSD-95 Ovxp) and a slice-matched control neuron. (Bottom) Summary shows a significant decrease in NMDAR EPSC decay time in PSD-95 overexpressing neurons (control: 0.45 ± 0.03 s, n = 17; PSD-95 Ovxp: 0.34 ± 0.03 s, n = 19; *P < 0.05). Sample traces (H) and scatter plot (I) of pharmacologically isolated NMDAR EPSCs recorded simultaneously in the presence of ifenprodil revealed a significant increase in the peak amplitude in PSD-95 overexpressing neurons relative to control. (Scale bar: A = 20 pA, 25 ms; D and H = 10 pA, 25 ms; C, F, and G = 200 ms.)
Fig. 5.
PSD-95 expression rescues deficit in synapse maturation in PSD-95−/−/PSD-93−/− mice. (A) NMDAR-mediated field EPSPs (Top) and input-out curve (Bottom) show that for each input (fiber volley [FV]), the output (field EPSP slope) is unchanged. Each point represents mean ± SEM for each FV (control: n = 22, 24, 20, 19, and 17 slices for FVs 0.1, 0.2, 03, 0.4, and 0.5 mV, respectively; PSD-95−/−/PSD-93−/−: n = 24, 23, 19, 19, and 10 slices for FVs 0.1, 0.2, 03, 0.4, and 0.5 mV, respectively; P > 0.05 for all FVs). (B) (Top) NMDAR EPSCs recorded from P30–P40 mice. (Bottom) Graph shows a significant increase in NMDAR EPSC decay time in PSD-95−/−/PSD-93−/− (control: 0.24 ± 0.01 s, n = 10; PSD-93−/−: 0.25 ± 0.01 s, n = 10; PSD-95−/−: 0.24 ± 0.74 s, n = 13; PSD-95−/−/PSD-93−/−: 0.34 ± 0.01 s, n = 10; ns P > 0.05; ***P < 0.001). (C) (Top) NMDAR EPSCs recorded before (black traces) and 20–25 min after (arrow, gray traces) ifenprodil application. (Bottom) Percent of NMDAR EPSC remaining after ifenprodil application relative to baseline (control: 80%; PSD-95−/−/PSD-93−/−: 38.5 ± 2.1%, n = 10). (D) AMPAR (Left) and NMDAR (Right) EPSCs recorded simultaneously from PSD-95 overexpressing (PSD-95 Ovxp) and uninfected control neurons in PSD-95−/−/PSD-93−/− slice cultures. (E) Scatter plot demonstrates that PSD-95 overexpression significantly increases AMPAR EPSC (red circles) amplitudes (control: −45.85 ± 12.39 pA; PSD-95 Ovxp: −301.15 ± 40.44 pA; n = 13 pairs; ***P < 0.001), without affecting NMDAR EPSC (blue circles) peak amplitudes (control: 45.92 ± 8.47 pA; PSD-95 Ovxp: 52.21 ± 8.46 pA; n = 8 pairs; P = 0.46). (F) (Top) Peak-scaled NMDAR EPSCs recorded from PSD-95 overexpressing and slice-matched untransfected neurons. (Bottom) No significant difference in NMDAR EPSC decay times (control: 0.23 ± 0.01 s, n = 15; PSD-95 Ovxp: 0.23 ± 0.01 s; n = 12; P = 0.96). (G) (Top) Peak-scaled NMDAR EPSCs recorded from PSD-95−/−/PSD-93−/− neurons overexpressing PSD-95 and slice-matched untransfected control. (Bottom) Graph shows a significant decrease in NMDAR EPSC decay time in PSD-95−/−/PSD-93−/− neurons expressing PSD-95 (control: 0.31 ± 0.02 s, n = 20; PSD-95 Ovxp: 0.20 ± 0.01 s; n = 10; ***P < 0.001). (Scale bars: A = 0.1 mV, 5 ms; B = 20 pA, 200 ms, C = 10 pA, 25 ms; D = 25 pA, 25 ms; F and G = 200 ms.)
Similar articles
- Synapse-specific regulation of AMPA receptor function by PSD-95.
Béïque JC, Lin DT, Kang MG, Aizawa H, Takamiya K, Huganir RL. Béïque JC, et al. Proc Natl Acad Sci U S A. 2006 Dec 19;103(51):19535-40. doi: 10.1073/pnas.0608492103. Epub 2006 Dec 5. Proc Natl Acad Sci U S A. 2006. PMID: 17148601 Free PMC article. - Differential requirement for NMDAR activity in SAP97β-mediated regulation of the number and strength of glutamatergic AMPAR-containing synapses.
Liu M, Lewis LD, Shi R, Brown EN, Xu W. Liu M, et al. J Neurophysiol. 2014 Feb;111(3):648-58. doi: 10.1152/jn.00262.2013. Epub 2013 Nov 13. J Neurophysiol. 2014. PMID: 24225540 Free PMC article. - Synapse-specific and developmentally regulated targeting of AMPA receptors by a family of MAGUK scaffolding proteins.
Elias GM, Funke L, Stein V, Grant SG, Bredt DS, Nicoll RA. Elias GM, et al. Neuron. 2006 Oct 19;52(2):307-20. doi: 10.1016/j.neuron.2006.09.012. Neuron. 2006. PMID: 17046693 - Making of a Synapse: Recurrent Roles of Drebrin A at Excitatory Synapses Throughout Life.
Aoki C, Sherpa AD. Aoki C, et al. Adv Exp Med Biol. 2017;1006:119-139. doi: 10.1007/978-4-431-56550-5_8. Adv Exp Med Biol. 2017. PMID: 28865018 Review. - Promiscuous interactions between AMPA-Rs and MAGUKs.
Fitzjohn SM, Doherty AJ, Collingridge GL. Fitzjohn SM, et al. Neuron. 2006 Oct 19;52(2):222-4. doi: 10.1016/j.neuron.2006.10.002. Neuron. 2006. PMID: 17046684 Review.
Cited by
- Synaptic Consolidation Normalizes AMPAR Quantal Size following MAGUK Loss.
Levy JM, Chen X, Reese TS, Nicoll RA. Levy JM, et al. Neuron. 2015 Aug 5;87(3):534-48. doi: 10.1016/j.neuron.2015.07.015. Neuron. 2015. PMID: 26247861 Free PMC article. - An opposing function of paralogs in balancing developmental synapse maturation.
Favaro PD, Huang X, Hosang L, Stodieck S, Cui L, Liu YZ, Engelhardt KA, Schmitz F, Dong Y, Löwel S, Schlüter OM. Favaro PD, et al. PLoS Biol. 2018 Dec 26;16(12):e2006838. doi: 10.1371/journal.pbio.2006838. eCollection 2018 Dec. PLoS Biol. 2018. PMID: 30586380 Free PMC article. - The role of ionotropic glutamate receptors in childhood neurodevelopmental disorders: autism spectrum disorders and fragile x syndrome.
Uzunova G, Hollander E, Shepherd J. Uzunova G, et al. Curr Neuropharmacol. 2014 Jan;12(1):71-98. doi: 10.2174/1570159X113116660046. Curr Neuropharmacol. 2014. PMID: 24533017 Free PMC article. - A novel mutation in the DLG3 gene encoding the synapse-associated protein 102 (SAP102) causes non-syndromic mental retardation.
Zanni G, van Esch H, Bensalem A, Saillour Y, Poirier K, Castelnau L, Ropers HH, de Brouwer AP, Laumonnier F, Fryns JP, Chelly J. Zanni G, et al. Neurogenetics. 2010 May;11(2):251-5. doi: 10.1007/s10048-009-0224-y. Epub 2009 Oct 1. Neurogenetics. 2010. PMID: 19795139 - Muscarinic receptors induce LTD of NMDAR EPSCs via a mechanism involving hippocalcin, AP2 and PSD-95.
Jo J, Son GH, Winters BL, Kim MJ, Whitcomb DJ, Dickinson BA, Lee YB, Futai K, Amici M, Sheng M, Collingridge GL, Cho K. Jo J, et al. Nat Neurosci. 2010 Oct;13(10):1216-24. doi: 10.1038/nn.2636. Epub 2010 Sep 19. Nat Neurosci. 2010. PMID: 20852624
References
- Waites CL, Craig AM, Garner CC. Mechanisms of vertebrate synaptogenesis. Annu Rev Neurosci. 2005;28:251–274. - PubMed
- Wu G, Malinow R, Cline HT. Maturation of a central glutamatergic synapse. Science. 1996;274:972–976. - PubMed
Publication types
MeSH terms
Substances
LinkOut - more resources
Full Text Sources
Other Literature Sources
Research Materials


