Interhemispheric correlations of slow spontaneous neuronal fluctuations revealed in human sensory cortex - PubMed (original) (raw)
Roy Mukamel, Ilan Dinstein, Eran Privman, Michal Harel, Lior Fisch, Hagar Gelbard-Sagiv, Svetlana Kipervasser, Fani Andelman, Miri Y Neufeld, Uri Kramer, Amos Arieli, Itzhak Fried, Rafael Malach
Affiliations
- PMID: 19160509
- PMCID: PMC2642673
- DOI: 10.1038/nn.2177
Interhemispheric correlations of slow spontaneous neuronal fluctuations revealed in human sensory cortex
Yuval Nir et al. Nat Neurosci. 2008 Sep.
Abstract
Animal studies have shown robust electrophysiological activity in the sensory cortex in the absence of stimuli or tasks. Similarly, recent human functional magnetic resonance imaging (fMRI) revealed widespread, spontaneously emerging cortical fluctuations. However, it is unknown what neuronal dynamics underlie this spontaneous activity in the human brain. Here we studied this issue by combining bilateral single-unit, local field potentials (LFPs) and intracranial electrocorticography (ECoG) recordings in individuals undergoing clinical monitoring. We found slow (<0.1 Hz, following 1/f-like profiles) spontaneous fluctuations of neuronal activity with significant interhemispheric correlations. These fluctuations were evident mainly in neuronal firing rates and in gamma (40-100 Hz) LFP power modulations. Notably, the interhemispheric correlations were enhanced during rapid eye movement and stage 2 sleep. Multiple intracranial ECoG recordings revealed clear selectivity for functional networks in the spontaneous gamma LFP power modulations. Our results point to slow spontaneous modulations in firing rate and gamma LFP as the likely correlates of spontaneous fMRI fluctuations in the human sensory cortex.
Figures
Figure 1
Two models of possible neuronal activity underlying fMRI events. Correlated fMRI fluctuations from right (gray) and left (black) hemispheres (top row) could be generated by different underlying neuronal events (middle row) associated with different power spectra of interhemispheric correlations (bottom row). Model 1 (left column): fMRI activation generated by transient (~100–300 ms), high-firing-rate neuronal events. Model 2 (right column): fMRI activation generated by slow (on the order of seconds), low-firing-rate neuronal events. Both neuronal events include noise and temporal jitter. Fast neuronal events (model 1) would show interhemispheric correlations in all frequencies, whereas slow neuronal events (model 2) would show interhemispheric correlations predominantly in low frequencies (bottom row). Because of the temporal integration of the hemodynamic response, both neuronal dynamics could generate similar fMRI fluctuations (top row).
Figure 2
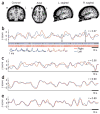
Interhemispheric comparison of slow spontaneous activity in human auditory cortex. (a) Estimated anatomical locations of auditory electrodes in patients 1–3 (red, blue and green, respectively). (b–e) Examples of correlated slow fluctuations (<0.1 Hz) in neuronal activity of auditory cortex from the right (red) and left (blue) hemispheres. b, Firing-rate modulations during rest. Vertical lines show actual spike times. Black arrows indicate the relation between time courses of slow firing-rate modulations and actual spikes. Waveforms of neuronal action potentials are shown below spike trains (blue, left hemisphere; red, right hemisphere; gray zone, s.e.m. across spike instances). (c) LFP gamma-power modulations during wakeful rest. (d) LFP gamma-power modulations during REM sleep. (e) LFP gamma-power modulations during stage 2 sleep. Data in all examples were recorded in the same microwires of patient 2. Slow modulations tend to correlate across hemispheres, and correlations were markedly enhanced during sleep.
Figure 3
Profiles of correlated spontaneous activity. Spectral distributions of interhemispheric correlations are shown in a–d for firing-rate and gamma-power modulations. Histograms show fast (>1 Hz), medium (0.1–1 Hz) and slow (<0.1 Hz) fluctuations. *P < 0.05 relative to null distribution assessed by bootstrapping (t test); **P < 0.0005. Error bars denote s.e.m. between recording sessions (wake) or recording segments (sleep). (a) Correlations in neuronal firing rates during wakeful rest (n = 8 recording sessions comprising 38:47 min of data in two individuals). (b) Correlations in LFP gamma power during wakeful rest (n = 12 recording sessions comprising 78:27 min of data in five individuals). (c) Correlations in LFP gamma power during REM sleep (n = 17 recording segments comprising 85 min of data in one individual). (d) Correlations in LFP gamma power during stage 2 sleep (n = 13 recording segments comprising 65 min of data in one individual). Low-frequency bias was observed in all correlations of interest, in agreement with model 2 (Fig. 1).
Figure 4
Cross- and autocorrelograms. Cross- and autocorrelation functions of signals from left and right auditory cortices. (a) Cross- and autocorrelations of neuronal firing rates during wakeful rest (n = 8 recording sessions comprising 38:47 min of data in two individuals). Green, cross-correlation; black, autocorrelation. Red arrows indicate very slow elevation in correlation (±10 s) corresponding to very slow correlated fluctuations <0.1 Hz. Inset shows Fourier transform of cross- and autocorrelation functions (cross-spectrum and spectrum, respectively) showing 1/_f_-like distributions. (b) Cross- and autocorrelations of LFP gamma power during wakeful rest (n = 9 recording sessions comprising 49:07 min of data in three individuals). Orange, cross-correlation; black, autocorrelation. Inset as in a. (c) Cross- and autocorrelations of LFP gamma power during REM and stage 2 sleep (n = 30 recording segments comprising 150 min of data in one individual). Purple, cross-correlation; black, autocorrelation; gray, raw LFP above 1 Hz. Raw LFP, in which no correlations were found across hemispheres, is markedly different from gamma-power changes showing robust correlations. Inset and red arrows as in a. For all panels, y axis is truncated around peak levels of cross-correlation, whereas autocorrelation reaches 1 at lag zero (data not shown).
Figure 5
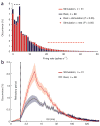
Firing-rate and ISI distributions during rest and stimulation. (a) Distribution of firing rates during auditory stimulation and spontaneous activity. Gray bars mark s.e.m. across neurons. Low firing rates (1–4 spikes s−1) were significantly more frequent during rest, whereas high firing rates (>20 spikes s−1) were significantly more frequent during stimulation, in accordance with model 1 (Fig. 1). (b) ISI distributions during auditory stimulation and spontaneous activity. x axis is shown on a log scale. Area left of dotted line shows 1- to 2-ms interval for which no such ISIs were found, reflecting the spike refractory period indicative of single-unit recordings. Shaded areas denote s.e.m. across neurons. Short ISIs (3–20 ms), reflecting bursts of high firing rates, were more frequent during stimulation (model 1 in Fig. 1) than during rest (model 2 in Fig. 1).
Figure 6
Spatial topography of spontaneous correlations in intracranial ECoG data. (a) Correlations between slow spontaneous changes (<0.1 Hz) in ECoG gamma power of an auditory-related electrode of patient 4 (‘seed’, purple arrow, 49) and all other electrodes. Results are shown on a cortical reconstruction of the individual’s brain as seen from a lateral view. Color of electrodes denotes their correlation with the seed electrode’s activity. The strongest correlation in the left hemisphere (green arrow, 23) is found in a corresponding anatomical location. (b) Strength and variability of correlations with auditory seed electrode (purple circle, 49). Bars show mean correlations ± s.e.m. between nonoverlapping 2-min data segments. *P <0.05 (t test) compared to all other electrodes in the left hemisphere. (c) Correlations between slow spontaneous changes (<0.1 Hz) in ECoG gamma power of a visual-related electrode of the same individual (‘seed’, purple arrow, 37) and all other electrodes. Results shown using a ventral view (left) and lateral view (right). The strongest correlation in the left hemisphere (green arrow, 12) is found in a corresponding anatomical location. Minimal correlation was observed between visual and auditory electrodes, indicating the functional selectivity of spontaneous correlations. (d) Strength and variability of correlations with visual seed electrode (purple circle, 37). *P < 0.05 (t test) compared to all other electrodes except for adjacent electrode 13.
Comment in
- Finding coherence in spontaneous oscillations.
Drew PJ, Duyn JH, Golanov E, Kleinfeld D. Drew PJ, et al. Nat Neurosci. 2008 Sep;11(9):991-3. doi: 10.1038/nn0908-991. Nat Neurosci. 2008. PMID: 18725901
Similar articles
- Contrasting activity profile of two distributed cortical networks as a function of attentional demands.
Popa D, Popescu AT, Paré D. Popa D, et al. J Neurosci. 2009 Jan 28;29(4):1191-201. doi: 10.1523/JNEUROSCI.4867-08.2009. J Neurosci. 2009. PMID: 19176827 Free PMC article. - Neural correlates of high-gamma oscillations (60-200 Hz) in macaque local field potentials and their potential implications in electrocorticography.
Ray S, Crone NE, Niebur E, Franaszczuk PJ, Hsiao SS. Ray S, et al. J Neurosci. 2008 Nov 5;28(45):11526-36. doi: 10.1523/JNEUROSCI.2848-08.2008. J Neurosci. 2008. PMID: 18987189 Free PMC article. - Cortical deactivation induced by subcortical network dysfunction in limbic seizures.
Englot DJ, Modi B, Mishra AM, DeSalvo M, Hyder F, Blumenfeld H. Englot DJ, et al. J Neurosci. 2009 Oct 14;29(41):13006-18. doi: 10.1523/JNEUROSCI.3846-09.2009. J Neurosci. 2009. PMID: 19828814 Free PMC article. - Temporal dynamics of cortical sources underlying spontaneous and peripherally evoked slow waves.
Riedner BA, Hulse BK, Murphy MJ, Ferrarelli F, Tononi G. Riedner BA, et al. Prog Brain Res. 2011;193:201-18. doi: 10.1016/B978-0-444-53839-0.00013-2. Prog Brain Res. 2011. PMID: 21854964 Free PMC article. Review. - High-frequency gamma oscillations and human brain mapping with electrocorticography.
Crone NE, Sinai A, Korzeniewska A. Crone NE, et al. Prog Brain Res. 2006;159:275-95. doi: 10.1016/S0079-6123(06)59019-3. Prog Brain Res. 2006. PMID: 17071238 Review.
Cited by
- Resting-state functional connectivity of ventral parietal regions associated with attention reorienting and episodic recollection.
Daselaar SM, Huijbers W, Eklund K, Moscovitch M, Cabeza R. Daselaar SM, et al. Front Hum Neurosci. 2013 Feb 22;7:38. doi: 10.3389/fnhum.2013.00038. eCollection 2013. Front Hum Neurosci. 2013. PMID: 23440005 Free PMC article. - Two-photon microscopy as a tool to study blood flow and neurovascular coupling in the rodent brain.
Shih AY, Driscoll JD, Drew PJ, Nishimura N, Schaffer CB, Kleinfeld D. Shih AY, et al. J Cereb Blood Flow Metab. 2012 Jul;32(7):1277-309. doi: 10.1038/jcbfm.2011.196. Epub 2012 Feb 1. J Cereb Blood Flow Metab. 2012. PMID: 22293983 Free PMC article. Review. - Correlated inter-regional variations in low frequency local field potentials and resting state BOLD signals within S1 cortex of monkeys.
Wilson GH 3rd, Yang PF, Gore JC, Chen LM. Wilson GH 3rd, et al. Hum Brain Mapp. 2016 Aug;37(8):2755-66. doi: 10.1002/hbm.23207. Epub 2016 Apr 19. Hum Brain Mapp. 2016. PMID: 27091582 Free PMC article. - FMRI resting slow fluctuations correlate with the activity of fast cortico-cortical physiological connections.
Koch G, Bozzali M, Bonnì S, Giacobbe V, Caltagirone C, Cercignani M. Koch G, et al. PLoS One. 2012;7(12):e52660. doi: 10.1371/journal.pone.0052660. Epub 2012 Dec 20. PLoS One. 2012. PMID: 23285136 Free PMC article. - Resting oscillations and cross-frequency coupling in the human posteromedial cortex.
Foster BL, Parvizi J. Foster BL, et al. Neuroimage. 2012 Mar;60(1):384-91. doi: 10.1016/j.neuroimage.2011.12.019. Epub 2011 Dec 29. Neuroimage. 2012. PMID: 22227048 Free PMC article.
References
- Llinas RR. The intrinsic electrophysiological properties of mammalian neurons: insights into central nervous system function. Science. 1988;242:1654–1664. - PubMed
- Arieli A, Sterkin A, Grinvald A, Aertsen A. Dynamics of ongoing activity: explanation of the large variability in evoked cortical responses. Science. 1996;273:1868–1871. - PubMed
- Kenet T, Bibitchkov D, Tsodyks M, Grinvald A, Arieli A. Spontaneously emerging cortical representations of visual attributes. Nature. 2003;425:954–956. - PubMed
- Leopold DA, Murayama Y, Logothetis NK. Very slow activity fluctuations in monkey visual cortex: implications for functional brain imaging. Cereb Cortex. 2003;13:422–433. - PubMed
Publication types
MeSH terms
Substances
LinkOut - more resources
Full Text Sources
Other Literature Sources


