Gastrointestinal growth factors and hormones have divergent effects on Akt activation - PubMed (original) (raw)
Comparative Study
Gastrointestinal growth factors and hormones have divergent effects on Akt activation
Marc J Berna et al. Cell Signal. 2009 Apr.
Abstract
Akt is a central regulator of apoptosis, cell growth and survival. Growth factors and some G-protein-coupled receptors (GPCR) regulate Akt. Whereas growth-factor activation of Akt has been extensively studied, the regulation of Akt by GPCR's, especially gastrointestinal hormones/neurotransmitters, remains unclear. To address this area, in this study the effects of GI growth factors and hormones/neurotransmitters were investigated in rat pancreatic acinar cells which are high responsive to these agents. Pancreatic acini expressed Akt and 5 of 7 known pancreatic growth-factors stimulate Akt phosphorylation (T308, S473) and translocation. These effects are mediated by p85 phosphorylation and activation of PI3K. GI hormones increasing intracellular cAMP had similar effects. However, GI-hormones/neurotransmitters [CCK, bombesin, carbachol] activating phospholipase C (PLC) inhibited basal and growth-factor-stimulated Akt activation. Detailed studies with CCK, which has both physiological and pathophysiological effects on pancreatic acinar cells at different concentrations, demonstrated CCK has a biphasic effect: at low concentrations (pM) stimulating Akt by a Src-dependent mechanism and at higher concentrations (nM) inhibited basal and stimulated Akt translocation, phosphorylation and activation, by de-phosphorylating p85 resulting in decreasing PI3K activity. This effect required activation of both limbs of the PLC-pathway and a protein tyrosine phosphatase, but was not mediated by p44/42 MAPK, Src or activation of a serine phosphatase. Akt inhibition by CCK was also found in vivo and in Panc-1 cancer cells where it inhibited serum-mediated rescue from apoptosis. These results demonstrate that GI growth factors as well as gastrointestinal hormones/neurotransmitters with different cellular basis of action can all regulate Akt phosphorylation in pancreatic acinar cells. This regulation is complex with phospholipase C agents such as CCK, because both stimulatory and inhibitory effects can be seen, which are mediated by different mechanisms.
Figures
Fig. 1
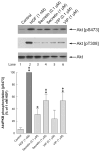
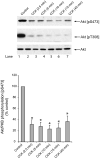
Ability of growth factors to stimulate Akt S473 and T308 phosphorylation in rat pancreatic acini. Top: rat pancreatic acini were treated with no additions, with 1 nM HGF for 10 min or with EGF, PDGF, bFGF, Insulin, VEGF or IGF1 in the indicated concentrations for 5 min and then lysed. Western blots were analyzed using either anti-pS473 Akt or anti-pT308 Akt antibodies. Membranes were stripped and re-blotted with total Akt antibody as loading control. Bands were visualized using chemiluminescence and quantified by densitometry. Results of a representative blot of 4 independent experiments are shown. Bottom: Means±S.E. of 4 independent experiments. Results are expressed as % of maximal stimulation obtained with HGF. * p<0.05, ** p<0.01 compared to control.
Fig. 2
Basal and growth-factor-stimulated Akt activity is regulated by PI3K in rat pancreatic acini. Rat pancreatic acini were pre-incubated without additions, with wortmannin or LY294002 for 30 min and then treated with no additions (control) or with 1 nM HGF for 10 min or 100 ng/ml PDGF for 5 min. Western blots were analyzed using anti-pS473 Akt antibody. Membranes were stripped and re-blotted with total Akt antibody as loading control. Bands were visualized using chemiluminescence. Results of a representative blot of 3 independent experiments are shown.
Fig. 3
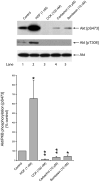
Ability of gastrointestinal hormones that increase cellular cAMP to stimulate Akt S473 and T308 phosphorylation in rat pancreatic acini. Top: rat pancreatic acini were treated with no additions, with 1 nM HGF for 10 min, with Secretin or VIP in the indicated concentrations for 5 min and then lysed. Western blots were analyzed using either anti-pS473 Akt or anti-pT308 Akt antibodies. Membranes were stripped and re-blotted with total Akt antibody as loading control. Bands were visualized using chemiluminescence and quantified by densitometry. Results of a representative blot of 4 independent experiments are shown. Bottom: Means±S.E. of 4 independent experiments. Results are expressed as % of maximal stimulation obtained with HGF. * p<0.05, ** p<0.01 compared to control.
Fig. 4
Ability of gastrointestinal hormones that increase cellular calcium to alter Akt S473 and T308 phosphorylation in rat pancreatic acini. Top: rat pancreatic acini were treated with no additions, with 1 nM HGF for 10 min, with cholecystokinin (CCK), carbachol or bombesin in the indicated concentrations for 5 min and then lysed. Western blots were analyzed using either anti-pS473 Akt or anti-pT308 Akt antibodies. Membranes were stripped and re-blotted with total Akt antibody as loading control. Bands were visualized using chemiluminescence and quantified by densitometry. Results of a representative blot of 6 independent experiments are shown. Bottom: Means±S.E. of 6 independent experiments. Results are expressed as % of basal stimulation in the control group. * p<0.05, ** p<0.01 compared to the control group.
Fig. 5
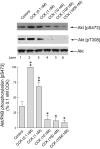
Dose-response of CCK's effect on Akt phosphorylation in rat pancreatic acini. Top: rat pancreatic acini were treated with no additions, with 1 nM HGF for 10 min or CCK in the indicated concentrations for 2.5 min and then lysed. Western blots were analyzed using either anti-pS473 Akt or anti-pT308 Akt antibodies. Membranes were stripped and re-blotted with total Akt antibody as loading control. Bands were visualized using chemiluminescence and quantified by densitometry. Results of a representative blot of 6 independent experiments are shown. Results are expressed as % of maximal stimulation with HGF. Bottom: Means±S.E. of 6 independent experiments. * p<0.05, ** p<0.01 compared to the control group.
Fig. 6
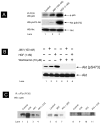
Akt stimulation by the high-affinity CCKA-receptor state is mediated by PI3K stimulation. A: rat pancreatic acini were treated with no additions, with the high affinity CCKA-receptor state agonist JMV (100 nM) or with 1 nM HGF for 2.5 min and then lysed. Lysates were immunoprecipitated with anti-phospho-tyrosine antibody (clone PY20). Immunoprecipitates or total cell lysates were analyzed using total p85 or anti-pS473 Akt antibodies, respectively. Membranes were stripped and re-blotted with total Akt antibody as loading control. Results of a representative blot of 5 independent experiments are shown. B: acini were pre-treated with no additions or with wortmannin (10 μM) for 30 minutes and than stimulated with no additions, with JMV (100 nM) or with 1 nM HGF for 2.5 min and then lysed. Western blots were analyzed using anti-pS473 Akt antibodies. Membranes were stripped and re-blotted with total Akt antibody as loading control. Results of a representative blot of 3 independent experiments are shown. C: acini were pre-treated with no aditions, with PP2 (10 μM) or PP3 (10 μM) for 60 minutes and then stimulated with the high affinity CCKA-receptor state agonist JMV (100 nM) or with 0.1 nM CCK for 2.5 min and then lysed. Lysates were immunoprecipitated with anti-phospho-tyrosine antibody (clone PY20). Immunoprecipitates or total cell lysates were analyzed using total p85. Results of a representative blot of 3 independent experiments are shown.
Fig. 7
Time course of CCK's effect on Akt phosphorylation in rat pancreatic acini. Top: rat pancreatic acini were treated with no additions or with 100 nM CCK for the indicated amount of time. Western blots were analyzed using either anti-pS473 Akt or anti-pT308 Akt antibodies. Membranes were stripped and re-blotted with total Akt antibody as loading control. Bands were visualized using chemiluminescence and quantified by densitometry. Results of a representative blot of 4 independent experiments are shown. Bottom: Means±S.E. of 4 independent experiments. Results are expressed as % of basal stimulation in the control group. * p<0.05 compared to the control group.
Fig. 8
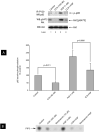
Akt inhibition by the low-affinity CCKA-receptor state is mediated by PI3K inhibition. Panel A (top). Rat pancreatic acini were treated with no additions, with CCK (100 nM), with 1 nM HGF or with both CCK and HGF for 2.5 min and then lysed. Lysates were immunoprecipitated with anti-phospho-tyrosine antibody (clone PY20). Immunoprecipitates and total cell lysates were analyzed using total p85 or anti-pS473 Akt antibodies, respectively. Membranes were stripped and re-blotted with total Akt antibody as loading control. Results of a representative blot of 6 independent experiments are shown. Panel A (bottom). Means±S.E. of 6 independent experiments. p85 tyrosine phosphorylation is expressed as % of basal stimulation in the control group. Panel B. Rat pancreatic acini were preincubated with and without of 10 μM wortmannin for 15 min, and then incubated in the presence or in the absence of 0.1 μM CCK or 1 nM HGF for further 10 min. PI3K was determined as PIP3 phosphorylation in p85 immunoprecipates, obtained from rat acini lysates, in the presence of phosphatidylinositol/phosphatidylserine and ATP; after lipid extraction and TLC, radioactive PIP3 was visualized by autoradiography and analyzed by densitometric scanning. Results are representative of 5 experiments.
Fig. 9
Effect of post-receptor stimulants on Akt S473 and T308 phosphorylation in rat pancreatic acini. Top: rat pancreatic acini were treated with no additions, with the phorbol ester TPA (1 μM), with the calcium ionophore A23187(1 μM), with thapsigargin (1 μM) or a combination for 5 min and then lysed. Western blots were analyzed using either anti-pS473 Akt or anti-pT308 Akt antibodies. Membranes were stripped and re-blotted with total Akt antibody as loading control. Bands were visualized using chemiluminescence and quantified by densitometry. Results of a representative blot of 4 independent experiments are shown. Bottom: Means±S.E. of 4 independent experiments. Results are expressed as % of basal stimulation in the control group. ** p<0.01 compared to control.
Fig. 10
Effect of the PKC inhibitor GF109203X and/or depletion of intracellular calcium with thapsigargin on CCK- mediated inhibition of Akt phosphorylation in rat pancreatic acini. Cells were pretreated with no additions, with GF109203X (50 μM) for 2 h or with thapsigargin (1 μM) in a calcium-free medium (with EGTA 5 μM) for 1 h. Acini were then incubated with no additions (control), with 100 nM CCK for 10 and then lysed. Top panel: Cell lysates were analyzed by western Blot using anti-pS473 Akt and anti pS916 PKD antibodies. Membranes were stripped and re-blotted with total Akt antibody as loading control. Bands were visualized using chemiluminescence and quantified by densitometry. Results of a representative blot of 3 independent experiments are shown. Bottom: Means±S.E. of 4 independent experiments. Results are expressed as % of basal stimulation in the control group.
Fig. 11
Effect of protein phosphatase inhibitors on CCK-mediated inhibition of Akt phosphorylation in rat pancreatic acini. Panel A. Cells were pretreated with no additions or with okadaic acid (100 nM) for 30 min. Cells were then stimulated with no additions or with 100 nM CCK for 10 minutes and then lysed. Western blots were analyzed using anti-pS473 Akt antibodies. Membranes were stripped and re-blotted with total Akt antibody as loading control. Bands were visualized using chemiluminescence and quantified by densitometry. Results of a representative blot of 3 independent experiments are shown. To illustrate that okadaic acid had a cellular effect and allow comparison of the okadaic acid group with the control group, a long and a short exposure of the okadaic acid group is shown. Panel B. Cells were pretreated with no additions or with sodium pervanadate (50 μM) for 30 min. Cells were then stimulated with no additions or with 100 nM CCK for 10 minutes and then lysed. Western blots were analyzed using anti-pS473 Akt antibodies. Membranes were stripped and re-blotted with total Akt antibody as loading control. Bands were visualized using chemiluminescence and quantified by densitometry. Results of a representative blot of 3 independent experiments are shown.
Fig. 12
CCK-mediated Akt inhibition is not mediated by p44/42 MAPK or Src. Rat pancreatic acini were pretreated with no additions or with the Src inhibitor PP2 (10 μM), the inactive analogue PP3 (10 μM) or the MEK inhibitor U0126 (20 μM) for 1 h. Cells were then treated with no additions, with CCK (100 nM) or with HGF (1 nM) for 10 min and then lysed. Cell lysates were analyzed by Western Blot using anti-pS473 Akt, anti-pT308 Akt, anti-phospho-p44/42 MAPK or anti-pY416 Src antibodies. Membranes were stripped and re-blotted with total Akt antibody as loading control. Bands were visualized using chemiluminescence and quantified by densitometry. Results of a representative blot of 3 independent experiments are shown.
Fig. 13
Effect of CCK on Akt activation in vivo. Left: rats were injected intraperitoneally with saline or CCK at the indicated dose. After 20 min, rats were sacrificed and acini isolated. Cell lysates were analyzed by Western blotting using anti-pS473 Akt antibody. Membranes were stripped and re-blotted with total Akt antibody as loading control. Bands were visualized using chemiluminescence and quantified by densitometry. Results of a representative blot of 4 independent experiments are shown. Right: rats were injected intraperitoneally with saline or CCK (10 ug/kg) and after 20 or 60 min, rats were sacrificed and acini isolated as processed as described above. Means±S.E. of 4 independent experiments. Results are expressed as % of basal stimulation in the control group. * p<0.05, ** p<0.01 compared to control.
Fig. 14
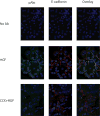
CCK inhibits HGF-mediated Akt activation in situ. Acini were treated with HGF (1 nM) for 5 min or with CCK (100 nM, 5 min) followed by HGF (1 nM, 5 min). Cells were fixed in paraformaldehyde, transferred to poly-L-lysine coated glass slides by cytocentrifugation and processed as described in Methods. Cells were stained using isotype-matched controls (No Ab), rabbit pS473 Akt or mouse E-cadherin and detected using anti-rabbit coupled to Alexa 488 (green) and anti-mouse coupled to Alexa 555 (red) so that green staining represents pAkt and red staining represents E-cadherin. Cells shown are representative of >90% of cells present. Experiments were repeated three times with comparable results.
Fig. 15
CCK inhibits serum-mediated rescue from apoptosis. Panc-1 cells stably transfected with the CCKA-receptor were cultured in DMEM 10% FCS for 72h (Panel A), in the absence of serum for 72h (Panel B), serum-free for 48h followed by 5% serum for 24h (Panel C) or serum-free for 48h followed by 5%serum+CCK (100 nM) for 24h (Panel D). Cells were than stained with FITC-Annexin and propidiumiodide and 10000 events counted using FACS. Apoptotic cells are counted in the lower right quadrant. Numbers in quadrants represent the percentage of cells in each quadrant. A representative experiment of 3 independent experiments is shown.
Fig. 16
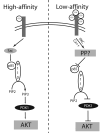
Differential regulation of the PI3K/Akt pathway by the high- and low-affinity CCKA-receptor in rat pancreatic acini. Arrowheads represent phosphorylation and stimulation while blocked lines represent inhibition. CCK: cholecystokinin; PIP2: phosphatidylinositol-2-phosphate; PIP3: phosphatidylinositol-3-phosphate; PTP?: unknown tyrosine phosphatase that directly or indirectly reduces p85 phosphorylation.
Similar articles
- PKCθ activation in pancreatic acinar cells by gastrointestinal hormones/neurotransmitters and growth factors is needed for stimulation of numerous important cellular signaling cascades.
Sancho V, Berna MJ, Thill M, Jensen RT. Sancho V, et al. Biochim Biophys Acta. 2011 Dec;1813(12):2145-56. doi: 10.1016/j.bbamcr.2011.07.007. Epub 2011 Jul 23. Biochim Biophys Acta. 2011. PMID: 21810446 Free PMC article. - The Src kinase Yes is activated in pancreatic acinar cells by gastrointestinal hormones/neurotransmitters, but not pancreatic growth factors, which stimulate its association with numerous other signaling molecules.
Sancho V, Nuche-Berenguer B, Jensen RT. Sancho V, et al. Biochim Biophys Acta. 2012 Aug;1823(8):1285-94. doi: 10.1016/j.bbamcr.2012.05.015. Epub 2012 May 19. Biochim Biophys Acta. 2012. PMID: 22617836 Free PMC article. - P21-activated kinase 4 in pancreatic acinar cells is activated by numerous gastrointestinal hormones/neurotransmitters and growth factors by novel signaling, and its activation stimulates secretory/growth cascades.
Ramos-Alvarez I, Jensen RT. Ramos-Alvarez I, et al. Am J Physiol Gastrointest Liver Physiol. 2018 Aug 1;315(2):G302-G317. doi: 10.1152/ajpgi.00005.2018. Epub 2018 Apr 19. Am J Physiol Gastrointest Liver Physiol. 2018. PMID: 29672153 Free PMC article. - Gastrointestinal hormones/neurotransmitters and growth factors can activate P21 activated kinase 2 in pancreatic acinar cells by novel mechanisms.
Nuche-Berenguer B, Jensen RT. Nuche-Berenguer B, et al. Biochim Biophys Acta. 2015 Oct;1853(10 Pt A):2371-82. doi: 10.1016/j.bbamcr.2015.05.011. Epub 2015 May 12. Biochim Biophys Acta. 2015. PMID: 25979836 Free PMC article. - CCK causes PKD1 activation in pancreatic acini by signaling through PKC-delta and PKC-independent pathways.
Berna MJ, Hoffmann KM, Tapia JA, Thill M, Pace A, Mantey SA, Jensen RT. Berna MJ, et al. Biochim Biophys Acta. 2007 Apr;1773(4):483-501. doi: 10.1016/j.bbamcr.2006.12.008. Epub 2006 Dec 24. Biochim Biophys Acta. 2007. PMID: 17306383 Free PMC article.
Cited by
- Elucidation of roles of serine/threonine phosphatases PP1 and PP2A in mediating CCK-stimulated growth and enzyme secretion in pancreatic acinar cells.
Ramos-Alvarez I, Jensen RT. Ramos-Alvarez I, et al. Am J Physiol Gastrointest Liver Physiol. 2025 Jul 1;329(1):G102-G121. doi: 10.1152/ajpgi.00308.2024. Epub 2025 May 15. Am J Physiol Gastrointest Liver Physiol. 2025. PMID: 40375576 Free PMC article. - PKD1 mediates negative feedback of PI3K/Akt activation in response to G protein-coupled receptors.
Ni Y, Sinnett-Smith J, Young SH, Rozengurt E. Ni Y, et al. PLoS One. 2013 Sep 9;8(9):e73149. doi: 10.1371/journal.pone.0073149. eCollection 2013. PLoS One. 2013. PMID: 24039875 Free PMC article. - CCK Receptor Inhibition Reduces Pancreatic Tumor Fibrosis and Promotes Nanoparticle Delivery.
Abraham T, Armold M, McGovern C, Harms JF, Darok MC, Gigliotti C, Adair B, Gray JL, Kelly DF, Adair JH, Matters GL. Abraham T, et al. Biomedicines. 2024 May 7;12(5):1024. doi: 10.3390/biomedicines12051024. Biomedicines. 2024. PMID: 38790986 Free PMC article. - The p21-activated kinase, PAK2, is important in the activation of numerous pancreatic acinar cell signaling cascades and in the onset of early pancreatitis events.
Nuche-Berenguer B, Ramos-Álvarez I, Jensen RT. Nuche-Berenguer B, et al. Biochim Biophys Acta. 2016 Jun;1862(6):1122-36. doi: 10.1016/j.bbadis.2016.02.008. Epub 2016 Feb 18. Biochim Biophys Acta. 2016. PMID: 26912410 Free PMC article. - Therapeutic potential for novel drugs targeting the type 1 cholecystokinin receptor.
Cawston EE, Miller LJ. Cawston EE, et al. Br J Pharmacol. 2010 Mar;159(5):1009-21. doi: 10.1111/j.1476-5381.2009.00489.x. Epub 2009 Nov 18. Br J Pharmacol. 2010. PMID: 19922535 Free PMC article. Review.
References
- Motley ED, Eguchi K, Gardner C, Hicks AL, Reynolds CM, Frank GD, Mifune M, Ohba M, Eguchi S. Hypertension. 2003;41:775–780. - PubMed
- Aikin R, Maysinger D, Rosenberg L. Endocrinology. 2004;145:4522–4531. - PubMed
- Yano S, Tokumitsu H, Soderling TR. Nature. 1998;396:584–587. - PubMed
- Summers SA, Kao AW, Kohn AD, Backus GS, Roth RA, Pessin JE, Birnbaum MJ. J Biol Chem. 1999;274:17934–17940. - PubMed
- Li L, Sampat K, Hu N, Zakari J, Yuspa SH. J Biol Chem. 2006;281:3237–3243. - PubMed
Publication types
MeSH terms
Substances
LinkOut - more resources
Full Text Sources
Molecular Biology Databases
Miscellaneous


