Glycosylated neurotensin analogues exhibit sub-picomolar anticonvulsant potency in a pharmacoresistant model of epilepsy - PubMed (original) (raw)
Glycosylated neurotensin analogues exhibit sub-picomolar anticonvulsant potency in a pharmacoresistant model of epilepsy
Hee-Kyoung Lee et al. ChemMedChem. 2009 Mar.
Abstract
Neurotensin (NT) is an endogenous neuropeptide involved in a variety of central and peripheral neuromodulatory effects. Herein we show the effects of site-specific glycosylation on the in vitro and in vivo pharmacological properties of this neuropeptide. NT analogues containing O-linked disaccharides (beta-melibiose and alpha-TF antigen) or beta-lactose units linked by a PEG(3) spacer were designed and chemically synthesized using Fmoc chemistry. For the latter analogue, Fmoc-Glu-(beta-Lac-PEG(3)-amide) was prepared. Our results indicate that the addition of the disaccharides does not negatively affect the sub-nanomolar affinity or the low-nanomolar agonist potency for the neurotensin receptor subtype 1 (NTS1). Interestingly, three glycosylated analogues exhibited sub-picomolar potency in the 6 Hz limbic seizure mouse model of pharmacoresistant epilepsy following intracerebroventricular administration. Our results suggest for the first time that chemically modified NT analogues may lead to novel antiepileptic therapies.
Figures
Figure 1. The structure of glycoamino acids introduced to NT and the C-terminal hexapeptide, NT(8–13)
Figure 2. Synthesis of Fmoc-Glu-(β-Lac-PEG3-amide), 4, the intermediate compound for the preparation of NT(8–13)-PEG3-Lac
a) Pentafluorophenol (PFP), DCC, CH2Cl2, rt, 72%; b) DIPEA, CH2Cl2, 57%; c) H2, 10% Pd/C, EtOAc, 70%.
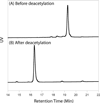
Figure 3. HPLC profile of NT-TF before deacetylation (A) and after deacetylation (B)
The retention time changed from 19.5 min to 16.3 min during deacetylation reaction. The analogs were purified by RP-HPLC using a semi-preparative C18 column in a linear gradient (5–65%) of Buffer B (90% acetonitrile, 0.1% TFA). The molecular weight of the analogs was confirmed by MALDI-TOF mass spectrometry.
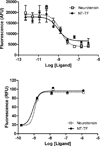
Figure 4. Receptor binding curve for NT analogs (top) and the agonist activity from functional assay (bottom)
The binding affinity of NT and NT-TF for NTS1 remains same, 0.5 nM. EC50 values in intracellular calcium mobilization assay for NT and NT-TF are 1.1 nM and 0.9 nM, respectively.
Figure 5. Dose response curves of NT and a representative glycosylated NT analog, NT-TF, in the 6 Hz (32 mA) anticonvulsant assay in mice following the icv administration
The log values of dose were plotted against the percentage of mice protected from seizures. The ED50 values for NT and NT-TF were 1.0 pmol and 0.4 pmol, respectively.
Similar articles
- Introduction of lipidization-cationization motifs affords systemically bioavailable neuropeptide Y and neurotensin analogs with anticonvulsant activities.
Green BR, White KL, McDougle DR, Zhang L, Klein B, Scholl EA, Pruess TH, White HS, Bulaj G. Green BR, et al. J Pept Sci. 2010 Sep;16(9):486-95. doi: 10.1002/psc.1266. J Pept Sci. 2010. PMID: 20645434 - Synthesis of neurotensin(9-13) analogues exhibiting enhanced human neurotensin receptor binding affinities.
Lundquist JT 4th, Büllesbach EE, Dix TA. Lundquist JT 4th, et al. Bioorg Med Chem Lett. 2000 Mar 6;10(5):453-5. doi: 10.1016/s0960-894x(00)00018-4. Bioorg Med Chem Lett. 2000. PMID: 10743946 - Synthesis and biological studies of novel neurotensin(8-13) mimetics.
Hong F, Zaidi J, Cusack B, Richelson E. Hong F, et al. Bioorg Med Chem. 2002 Dec;10(12):3849-58. doi: 10.1016/s0968-0896(02)00342-5. Bioorg Med Chem. 2002. PMID: 12413837 - Neurotensin agonists as an alternative to antipsychotics.
Boules M, Fredrickson P, Richelson E. Boules M, et al. Expert Opin Investig Drugs. 2005 Apr;14(4):359-69. doi: 10.1517/13543784.14.4.359. Expert Opin Investig Drugs. 2005. PMID: 15882113 Review. - The roles of neurotensin and its analogues in pain.
Feng YP, Wang J, Dong YL, Wang YY, Li YQ. Feng YP, et al. Curr Pharm Des. 2015;21(7):840-8. doi: 10.2174/1381612820666141027124915. Curr Pharm Des. 2015. PMID: 25345606 Review.
Cited by
- Disease-Modifying Effects of Neural Regeneration Peptide 2945 in the GAERS Model of Absence Epilepsy.
Dezsi G, Sieg F, Thomas M, O'Brien TJ, van der Hart M, Jones NC. Dezsi G, et al. Neurochem Res. 2017 Jul;42(7):2055-2064. doi: 10.1007/s11064-017-2305-x. Epub 2017 May 16. Neurochem Res. 2017. PMID: 28508994 - Analysis of carbohydrates and glycoconjugates by matrix-assisted laser desorption/ionization mass spectrometry: an update for 2009-2010.
Harvey DJ. Harvey DJ. Mass Spectrom Rev. 2015 May-Jun;34(3):268-422. doi: 10.1002/mas.21411. Epub 2014 May 26. Mass Spectrom Rev. 2015. PMID: 24863367 Free PMC article. Review. - Analgesic neuropeptide W suppresses seizures in the brain revealed by rational repositioning and peptide engineering.
Green BR, Smith M, White KL, White HS, Bulaj G. Green BR, et al. ACS Chem Neurosci. 2011 Jan 19;2(1):51-6. doi: 10.1021/cn1000974. Epub 2010 Nov 18. ACS Chem Neurosci. 2011. PMID: 22826747 Free PMC article. Review. - Neurotensin and Neurotensin Receptors in Stress-related Disorders: Pathophysiology & Novel Drug Targets.
Kyriatzis G, Khrestchatisky M, Ferhat L, Chatzaki EA. Kyriatzis G, et al. Curr Neuropharmacol. 2024;22(5):916-934. doi: 10.2174/1570159X21666230803101629. Curr Neuropharmacol. 2024. PMID: 37534788 Free PMC article. Review. - A marine analgesic peptide, Contulakin-G, and neurotensin are distinct agonists for neurotensin receptors: uncovering structural determinants of desensitization properties.
Lee HK, Zhang L, Smith MD, Walewska A, Vellore NA, Baron R, McIntosh JM, White HS, Olivera BM, Bulaj G. Lee HK, et al. Front Pharmacol. 2015 Feb 10;6:11. doi: 10.3389/fphar.2015.00011. eCollection 2015. Front Pharmacol. 2015. PMID: 25713532 Free PMC article.
References
- Vincent J-P, Mazella J, Kitabgi P. Trends Pharmacol. Sci. 1999;20:302–309. - PubMed
- Bissette G, Nemeroff CB, Loosen PT, Prange JAJ, Lipton MA. Nature. 1976;262:607–609. - PubMed
- Kitabgi P, De Nadai F, Labbe-Jullie C, Dubuc I, Nouel D, J C, Masuo Y, Rostene W, Woulfe J, Lafortune L. Clin. Neuropharmacol. 1992;15:313A–314A. - PubMed
- Nemeroff CB, Bissette G, Manberg PJ, Osbahr AJ, III, Breese GR, Prange AJJ. Brain Res. 1980;195:69–84. - PubMed
- Al-Rodhan NRF, Richelson E, Gilbert JA, McCormick DJ, Kanba KS, Pfenning MA, Nelson A, Larson EW, Yaksh TL. Brain Res. 1991;557:227–235. - PubMed
Publication types
MeSH terms
Substances
LinkOut - more resources
Full Text Sources
Medical
Research Materials
Miscellaneous


