Impact of normalization on miRNA microarray expression profiling - PubMed (original) (raw)
Impact of normalization on miRNA microarray expression profiling
Sylvain Pradervand et al. RNA. 2009 Mar.
Abstract
Profiling miRNA levels in cells with miRNA microarrays is becoming a widely used technique. Although normalization methods for mRNA gene expression arrays are well established, miRNA array normalization has so far not been investigated in detail. In this study we investigate the impact of normalization on data generated with the Agilent miRNA array platform. We have developed a method to select nonchanging miRNAs (invariants) and use them to compute linear regression normalization coefficients or variance stabilizing normalization (VSN) parameters. We compared the invariants normalization to normalization by scaling, quantile, and VSN with default parameters as well as to no normalization using samples with strong differential expression of miRNAs (heart-brain comparison) and samples where only a few miRNAs are affected (by p53 overexpression in squamous carcinoma cells versus control). All normalization methods performed better than no normalization. Normalization procedures based on the set of invariants and quantile were the most robust over all experimental conditions tested. Our method of invariant selection and normalization is not limited to Agilent miRNA arrays and can be applied to other data sets including those from one color miRNA microarray platforms, focused gene expression arrays, and gene expression analysis using quantitative PCR.
Figures
FIGURE 1.
Example of invariant probes selection. Removal of standard deviation (SD)-versus-mean trend is done by fitting loess (red line) to the scatter plot of SD versus mean (inset scatter plot). The invariant probes are identified from the mean and corrected standard deviation (main scatter plot). Probes with high mean are indicated in color, probes with low mean are in black. (Green) high mean probes belonging to the lowest SD component (“invariants”). (Blue and magenta) High mean probes belonging to higher SD components. (Open red circle) Positive control probes. (Open red triangle) Negative control probes. (Dashed line) Mean and SD cutoffs.
FIGURE 2.
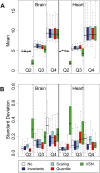
Effect of normalization on technical reproducibility. Data from brain and heart tissue samples were separated by quartile (Q1, Q2, Q3, Q4) based on the mean of unlogged unnormalized expression signal of the three technical replicates. Q1 corresponds to the bottom quartile and Q4 to the top quartile. Mean of log2 signal intensity (A) and standard deviation (B) of technical replicates were calculated for each normalization method, in each tissue and each quartile. VSN expression signals (in base e) were converted to base 2. (White) no normalization, (red) quantile, (blue) invariants, (cyan) scaling, (green) VSN.
FIGURE 3.
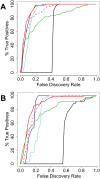
Sensitivity and specificity of the normalization methods. (A,B) Fraction of positives recovered plotted against the FDR for a 50% brain–50% heart RNA mixture compared to a 95% brain–5% heart RNA mixture (A) or a 50% brain–50% heart RNA mixture compared to a 75% brain–25% heart RNA mixture (B). Positives were defined as miRNAs among the 50% most strongly expressed in comparison to the pure heart and brain RNA samples with at least a threefold expression difference and a P < 0.01 as measured using any normalization methods. VSN expression signals (in base e) were converted to base 2. (Black) No normalization, (red) quantile, (blue) invariants, (cyan) scaling, (green) VSN, (magenta dashed line) VSN using invariants selected as in our invariants normalization method.
FIGURE 4.
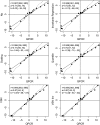
Fold-change concordance between QPCR assays and microarrays. Seventeen miRNAs spanning the entire fold-change range between heart and brain samples were selected for validation with TaqMan assays. All expression signals were converted into log2 and the differences in means (M values) measured with the different normalization methods (_y_-axis) were plotted against those determined by TaqMan assays (_x_-axis). Dashed lines represent the 45° lines of complete concordance. The solid lines represent the results of the regression analysis. Correlation coefficient (r), slope (a), and intercept (b) of regression lines are indicated. Ninety-five percent confidence intervals are indicated in square brackets. Confidence intervals for correlation coefficients were calculated using Fisher's transformation.
FIGURE 5.
Biological assessment of normalization methods using p53-induced miRNAs in human squamous carcinoma cell line SCC13. (A) Q-Q plots comparing the t statistics of Ad-p53 versus Ad-GFP samples (Sample Quantiles) against a t 10 distribution (Theoretical Quantiles). T statistics were calculated for the six Ad-p53 versus the six Ad-GFP samples (three biological replicates with two technical replicates) using data produced by each of the different normalized methods. Number of miRNAs and P values for a FDR cutoff of 5% are indicated. (B) Mean difference (M value) versus average expression (A value) plot for the different normalization methods. Probes with a FDR < 5% are indicated in open circles. (C) TaqMan QPCR validation of miRNAs. SCC13 cells were infected in biological triplicate with either Ad-GFP (white bars) or Ad-p53 (gray bars). Expression was calculated relative to the Z30 reference assay. Mean and standard error of four technical replicates are indicated.
Similar articles
- Profound effect of profiling platform and normalization strategy on detection of differentially expressed microRNAs--a comparative study.
Meyer SU, Kaiser S, Wagner C, Thirion C, Pfaffl MW. Meyer SU, et al. PLoS One. 2012;7(6):e38946. doi: 10.1371/journal.pone.0038946. Epub 2012 Jun 18. PLoS One. 2012. PMID: 22723911 Free PMC article. - Modified least-variant set normalization for miRNA microarray.
Suo C, Salim A, Chia KS, Pawitan Y, Calza S. Suo C, et al. RNA. 2010 Dec;16(12):2293-303. doi: 10.1261/rna.2345710. Epub 2010 Oct 27. RNA. 2010. PMID: 20980676 Free PMC article. - Optimal consistency in microRNA expression analysis using reference-gene-based normalization.
Wang X, Gardiner EJ, Cairns MJ. Wang X, et al. Mol Biosyst. 2015 May;11(5):1235-40. doi: 10.1039/c4mb00711e. Mol Biosyst. 2015. PMID: 25797570 - Introduction to miRNA profiling technologies and cross-platform comparison.
Aldridge S, Hadfield J. Aldridge S, et al. Methods Mol Biol. 2012;822:19-31. doi: 10.1007/978-1-61779-427-8_2. Methods Mol Biol. 2012. PMID: 22144189 Review. - Data Normalization Strategies for MicroRNA Quantification.
Schwarzenbach H, da Silva AM, Calin G, Pantel K. Schwarzenbach H, et al. Clin Chem. 2015 Nov;61(11):1333-42. doi: 10.1373/clinchem.2015.239459. Epub 2015 Sep 25. Clin Chem. 2015. PMID: 26408530 Free PMC article. Review.
Cited by
- Relationships of PBMC microRNA expression, plasma viral load, and CD4+ T-cell count in HIV-1-infected elite suppressors and viremic patients.
Witwer KW, Watson AK, Blankson JN, Clements JE. Witwer KW, et al. Retrovirology. 2012 Jan 12;9:5. doi: 10.1186/1742-4690-9-5. Retrovirology. 2012. PMID: 22240256 Free PMC article. - MiR-204 silencing in intraepithelial to invasive cutaneous squamous cell carcinoma progression.
Toll A, Salgado R, Espinet B, Díaz-Lagares A, Hernández-Ruiz E, Andrades E, Sandoval J, Esteller M, Pujol RM, Hernández-Muñoz I. Toll A, et al. Mol Cancer. 2016 Jul 25;15(1):53. doi: 10.1186/s12943-016-0537-z. Mol Cancer. 2016. PMID: 27457246 Free PMC article. - Differential miRNA expression profiles in proliferating or differentiated keratinocytes in response to gamma irradiation.
Joly-Tonetti N, Viñuelas J, Gandrillon O, Lamartine J. Joly-Tonetti N, et al. BMC Genomics. 2013 Mar 16;14:184. doi: 10.1186/1471-2164-14-184. BMC Genomics. 2013. PMID: 23496899 Free PMC article. - Micro-RNAs secreted through astrocyte-derived extracellular vesicles cause neuronal network degeneration in C9orf72 ALS.
Varcianna A, Myszczynska MA, Castelli LM, O'Neill B, Kim Y, Talbot J, Nyberg S, Nyamali I, Heath PR, Stopford MJ, Hautbergue GM, Ferraiuolo L. Varcianna A, et al. EBioMedicine. 2019 Feb;40:626-635. doi: 10.1016/j.ebiom.2018.11.067. Epub 2019 Jan 31. EBioMedicine. 2019. PMID: 30711519 Free PMC article. - A novel and universal method for microRNA RT-qPCR data normalization.
Mestdagh P, Van Vlierberghe P, De Weer A, Muth D, Westermann F, Speleman F, Vandesompele J. Mestdagh P, et al. Genome Biol. 2009;10(6):R64. doi: 10.1186/gb-2009-10-6-r64. Epub 2009 Jun 16. Genome Biol. 2009. PMID: 19531210 Free PMC article.
References
- Alvarez-Garcia I., Miska E.A. MicroRNA functions in animal development and human disease. Development. 2005;132:4653–4662. - PubMed
- Bartel D.P. MicroRNAs: Genomics, biogenesis, mechanism, and function. Cell. 2004;116:281–297. - PubMed
- Benjamini Y., Hochberg Y. Controlling the false discovery rate: A practical and powerful approach to multiple testing. J. R. Stat. Soc. Ser. B Methodol. 1995;57:289–300.
- Bolstad B.M., Irizarry R.A., Astrand M., Speed T.P. A comparison of normalization methods for high density oligonucleotide array data based on variance and bias. Bioinformatics. 2003;19:185–193. - PubMed
Publication types
MeSH terms
Substances
LinkOut - more resources
Full Text Sources
Other Literature Sources
Molecular Biology Databases
Research Materials
Miscellaneous


