Synergistic activation of glucose-6-phosphate dehydrogenase and NAD(P)H oxidase by Src kinase elevates superoxide in type 2 diabetic, Zucker fa/fa, rat liver - PubMed (original) (raw)
Synergistic activation of glucose-6-phosphate dehydrogenase and NAD(P)H oxidase by Src kinase elevates superoxide in type 2 diabetic, Zucker fa/fa, rat liver
Rakhee S Gupte et al. Free Radic Biol Med. 2009.
Abstract
Glucose metabolism through the glycolysis and hexosamine pathway has been shown to be altered in type 2 diabetes. However, the fate of glucose through the pentose phosphate pathway (PPP) is currently unclear. In this study, we determined whether the activity of glucose-6-phosphate dehydrogenase (G6PD), the rate-limiting enzyme in the PPP, is modulated in the liver of Zucker obese fa/fa rats (9-11 weeks of age). We found that G6PD expression and activity, NADPH levels, and 6-phosphogluconate generation were significantly increased in the liver of fa/fa rats. Inhibition of PI3 kinase and Src kinases decreased (p < 0.05) G6PD activity in the fa/fa but not in the lean rat liver, suggesting that G6PD activity is regulated by PI3/Src kinase signaling pathways. G6PD-derived NADPH increased (p < 0.05) superoxide anion levels by 70-90% in fa/fa vs lean rat liver, which was inhibited by the NADPH oxidase inhibitor gp91(ds-tat) (50 microM) and G6PD inhibitors 6-aminonicotinamide (1 mM) and dehydroepiandrosterone (100 microM), therefore indicating that elevated G6PD activity may be responsible for mediating superoxide generation. Interestingly, we also found a positive correlation between liver hypertrophy/increased G6PD activity (r2 = 0.77; p = 0.0009) and liver hypertrophy/superoxide production (r2 = 0.51; p = 0.0091) in fa/fa rats. Increased G6PD and NADPH oxidase expression and activity, in young hyperglycemic and hyperinsulinemic rats before the development of diabetes, seems to be a contributing factor in the induction of oxidative stress. Because inhibition of G6PD activity decreases oxidative stress, we conclude that G6PD behaves as a pro-oxidant in the fa/fa rat liver in type 2 diabetes.
Figures
Figure 1. Glucose-6-phosphate dehydrogenase activity is elevated in type 2 diabetic model
Zucker lean and fa/fa rat liver homogenates (Panel A top) and hepatocyte lysates (Panel A bottom) were analyzed on 9% SDS-PAGE. Western blot analysis was performed using rabbit polyclonal anti-G6PD antibody (A). All input lanes contain 35 μg of total protein content. Panel (A) represents one blot of six such independent experiments. (B) The graph represents G6PD protein expression in lean (n=6) and ZDF (n=6) rat liver as estimated by densitometric analysis (total: upper and lower band) and normalized with α-tubulin values. The graph represents G6PD activity (C), effect of NADP+-dependent on activity (D), NADPH levels (E) and 6-phospho-gluconate levels (F) from lean (n=6) and Zucker fa/fa (n=6) rat liver, respectively. Statistical analysis for (B–F) was performed using Student’s t-test and P<0.05 (lean versus Zucker fa/fa) was considered statistically significant.
Figure 2. Glucose-6-phosphate dehydrogenase is activated by Src kinase in the liver of Zucker fa/fa rats
(A) Zucker lean (lanes 1 & 3) and fa/fa (lanes 2 & 4) rat liver homogenates (Panel A top) and hepatocyte lysates (Panel A bottom) were analyzed on 9% SDS-PAGE. Western blot analysis was performed using rabbit polyclonal anti-pSrc (first panel) and anti-total Src antibody (second panel). All input lanes contain 35 μg of total protein content. Panel (A) represents one blot of six such independent experiments. (B) & (C) Graphs represents total-Src (B) and phosphorylated-Src416 (C) in lean (n=6) and ZDF (n=6) rat liver as estimated by densitometric analysis and normalized with total-Src or α-tubulin values. (D) & (E) Lean (D) and Zucker fa/fa (E) liver tissues were incubated at 37°C for 10 minutes without and with PI3 kinase inhibitor, LY294002 (10 μM), Src kinase inhibitor, PP2 (10 μM), and alkaline phosphatase (200 U/ml), respectively. Graphs represents glucose-6-phosphate dehydrogenase activity in, Lean (D) and Zucker fa/fa (E) liver homogenates, respectively. Statistical analysis was performed using Student’s t-test and P<0.05 (lean versus Zucker fa/fa) was considered statistically significant.
Figure 3. Protein expression of NAD(P)H oxidase is altered in Zucker fa/fa rat liver tissue
Lean and Zucker fa/fa rat liver homogenates (Panel A top) and hepatocyte lysates (Panel A bottom) were analyzed on 9% SDS-PAGE. Western blot analysis was performed using mouse monoclonal anti-Nox1 and -Nox2 (A; first & second panels), goat polyclonal anti-Nox4 (A; third panel), mouse monoclonal anti-p67_phox_ (A; fourth panel) and goat polyclonal anti-p47_phox_ (A; bottom panel) antibodies, respectively. All lanes contain 35 μg of total protein content. Panel (A) represents one blot of six such independent experiments. Panel B: Graph represents NADPH oxidase subunit expression in lean (n=6) and Zucker fa/fa (n=6) rat liver as estimated by densitometric analysis and normalized with α-tubulin values. Panel C: Lean and Zucker fa/fa rat liver tissue was fractionated by ultracentrifugation at 100,000×g to separate the membrane and cytoplasmic fractions. Graph represents levels of p47_phox_ found in membrane as compared to cytoplasmic fraction in Zucker fa/fa rat liver. Statistical analysis was performed using Student’s t-test and P<0.05 (lean versus ZDF) was considered statistically significant.
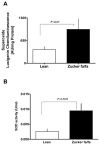
Figure 4. Superoxide generation is elevated in the liver of Zucker fa/fa rats
Liver homogenates obtained from lean (n=6) and Zucker fa/fa (n=6) rat were used to detected O2− production by lucigenin (5 μM) chemiluminescence (A); Superoxide dismutase activity (SOD; B). Statistical analysis was performed using Student’s t-test and P<0.05(lean versus Zucker fa/fa) was considered statistically significant.
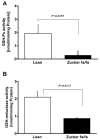
Figure 5. Glutathione peroxidase and reductase activity is decreased in the liver of Zucker fa/fa rats
Liver homogenates obtained from lean (n=6) and Zucker fa/fa (n=6) rat were used to estimate glutathione peroxidase (GSH-Px; A) and glutathione reductase (GSH reductase; B) activities.
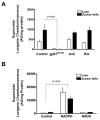
Figure 6. Superoxide generated in liver is NADPH-dependent
Liver homogenates obtained from lean (n=6) and Zucker fa/fa (n=6) animals were treated with: (A) either NADPH oxidase inhibitor, gp91_ds-tat_ (50 μM), mitochondrial respiratory chain inhibitors, antimycin (10 μM) and rotenone (50 μM), and superoxide levels were determined by lucigenin (5 μM) chemiluminescence. (B) NADPH (100 μM) or NADH (100 μM) for 10 minutes at 37°C, and superoxide levels were determined as described above. These experiments were performed in the absence of NADPH regenerating system. Statistical analysis was performed using Student’s t-test and P<0.05 was considered statistically significant.
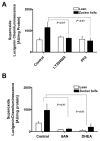
Figure 7. NADPH oxidase and glucose-6-phosphate dehydrogenase synergistically increases superoxide production in diabetic tissues
Liver tissues obtained from lean (n=6) and ZDF (n=6) animals were incubated (A) with PI3 kinase inhibitor, LY294002 (10 μM), and Src kinase inhibitor, PP2 (10 μM), for 10 minutes at 37°C and (B) either with 6-aminonicotinamide (5 mM) or dehydroepiandrosterone (DHEA; 100 μM), inhibitors of glucose-6-phosphate dehydrogenase, for 10 minutes at 37°C in the presence of NADPH regenerating system and superoxide levels were determined by lucigenin (5 μM) chemiluminescence. Statistical analysis was performed using Student’s t-test and P<0.05 (lean versus ZDF) was considered statistically significant.
Figure 8. Liver hypertrophy occurs in young Zucker fa/fa rats
Liver weight (A) and liver-to-body weight (B) was also determined in these rats. Graph represents the liver protein-to-DNA ratio in lean and Zucker fa/fa rats (C). The expression of PCNA in lean (lanes 1, 3, and 5) and Zucker fa/fa (lanes 2, 4, and 6) liver was determined by western blot analysis using mouse monoclonal anti-PCNA antibody (D). Correlation between liver weight and G6PD activity (E) or superoxide levels (F) was determined by regression analysis. Statistical analysis was performed using Student’s t-test and P<0.05 was considered statistically significant.
Figure 9. A schematic illustration of G6PD and NADPH oxidase activation in Zucker fa/fa rats
In the fa/fa rats, a congenital model of obesity and type 2 diabetes, changes in adipose tissue hormones and elevation in either insulin or glucose increases expression and activity of glucose-6-phosphate dehydrogenase (G6PD) and NADPH oxidases (Nox-1 and Nox-4). Conversely, glutathione reductase (GSH reductase) activity is decreased. This leads to an increase in superoxide (O2−) levels, which consequently either evokes liver growth or liver dysfunction.
Similar articles
- Superoxide production by NAD(P)H oxidase and mitochondria is increased in genetically obese and hyperglycemic rat heart and aorta before the development of cardiac dysfunction. The role of glucose-6-phosphate dehydrogenase-derived NADPH.
Serpillon S, Floyd BC, Gupte RS, George S, Kozicky M, Neito V, Recchia F, Stanley W, Wolin MS, Gupte SA. Serpillon S, et al. Am J Physiol Heart Circ Physiol. 2009 Jul;297(1):H153-62. doi: 10.1152/ajpheart.01142.2008. Epub 2009 May 8. Am J Physiol Heart Circ Physiol. 2009. PMID: 19429815 Free PMC article. - Upregulation of glucose-6-phosphate dehydrogenase and NAD(P)H oxidase activity increases oxidative stress in failing human heart.
Gupte RS, Vijay V, Marks B, Levine RJ, Sabbah HN, Wolin MS, Recchia FA, Gupte SA. Gupte RS, et al. J Card Fail. 2007 Aug;13(6):497-506. doi: 10.1016/j.cardfail.2007.04.003. J Card Fail. 2007. PMID: 17675065 - Glucose-6-phosphate dehydrogenase-derived NADPH fuels superoxide production in the failing heart.
Gupte SA, Levine RJ, Gupte RS, Young ME, Lionetti V, Labinskyy V, Floyd BC, Ojaimi C, Bellomo M, Wolin MS, Recchia FA. Gupte SA, et al. J Mol Cell Cardiol. 2006 Aug;41(2):340-9. doi: 10.1016/j.yjmcc.2006.05.003. Epub 2006 Jul 7. J Mol Cell Cardiol. 2006. PMID: 16828794 - Glucose-6-phosphate dehydrogenase: a novel therapeutic target in cardiovascular diseases.
Gupte SA. Gupte SA. Curr Opin Investig Drugs. 2008 Sep;9(9):993-1000. Curr Opin Investig Drugs. 2008. PMID: 18729006 Review. - Neuroprotection by glucose-6-phosphate dehydrogenase and the pentose phosphate pathway.
Tang BL. Tang BL. J Cell Biochem. 2019 Sep;120(9):14285-14295. doi: 10.1002/jcb.29004. Epub 2019 May 24. J Cell Biochem. 2019. PMID: 31127649 Review.
Cited by
- Renal inflammation combined with renal function reserve reduction accelerate kidney aging via pentose phosphate pathway.
Han B, Zhang Y, Liu C, Ji P, Xing Z, Geng X, Chi K, Gong M, Li Y, Zhang Y, Fu Z, Hong Q, Cai G, Chen X, Sun X. Han B, et al. iScience. 2024 May 22;27(6):110045. doi: 10.1016/j.isci.2024.110045. eCollection 2024 Jun 21. iScience. 2024. PMID: 38947529 Free PMC article. - Diabetic‑induced alterations in hepatic glucose and lipid metabolism: The role of type 1 and type 2 diabetes mellitus (Review).
Jiang S, Young JL, Wang K, Qian Y, Cai L. Jiang S, et al. Mol Med Rep. 2020 Aug;22(2):603-611. doi: 10.3892/mmr.2020.11175. Epub 2020 May 22. Mol Med Rep. 2020. PMID: 32468027 Free PMC article. Review. - Hepatic oxidative stress, genotoxicity and vascular dysfunction in lean or obese Zucker rats.
Løhr M, Folkmann JK, Sheykhzade M, Jensen LJ, Kermanizadeh A, Loft S, Møller P. Løhr M, et al. PLoS One. 2015 Mar 4;10(3):e0118773. doi: 10.1371/journal.pone.0118773. eCollection 2015. PLoS One. 2015. PMID: 25738756 Free PMC article. - Stress-induced GSK3 regulates the redox stress response by phosphorylating glucose-6-phosphate dehydrogenase in Arabidopsis.
Dal Santo S, Stampfl H, Krasensky J, Kempa S, Gibon Y, Petutschnig E, Rozhon W, Heuck A, Clausen T, Jonak C. Dal Santo S, et al. Plant Cell. 2012 Aug;24(8):3380-92. doi: 10.1105/tpc.112.101279. Epub 2012 Aug 10. Plant Cell. 2012. PMID: 22885737 Free PMC article. - Trodusquemine (MSI-1436) Restores Metabolic Flexibility and Mitochondrial Dynamics in Insulin-Resistant Equine Hepatic Progenitor Cells (HPCs).
Qasem B, Dąbrowska A, Króliczewski J, Łyczko J, Marycz K. Qasem B, et al. Cells. 2024 Jan 14;13(2):152. doi: 10.3390/cells13020152. Cells. 2024. PMID: 38247843 Free PMC article.
References
- Wild S, Roglic G, Green A, Sicree R, King H. Global prevalence of diabetes: estimates for the year 2000 and projections for 2030. Diabetes Care. 2004;27:1047–53. - PubMed
- Hink U, Li H, Mollnau H, Oelze M, Matheis E, Hartmann M, Skatchkov M, Thaiss F, Stahl RA, Warnholtz A, Meinertz T, Griendling K, Harrison DG, Forstermann U, Munzel T. Mechanisms underlying endothelial dysfunction in diabetes mellitus. Circ Res. 2001;88:E14–22. - PubMed
- Guzik TJ, Mussa S, Gastaldi D, Sadowski J, Ratnatunga C, Pillai R, Channon KM. Mechanisms of increased vascular superoxide production in human diabetes mellitus: role of NAD(P)H oxidase and endothelial nitric oxide synthase. Circulation. 2002;105:1656–62. - PubMed
- Creager MA, Luscher TF, Cosentino F, Beckman JA. Diabetes and vascular disease: pathophysiology, clinical consequences, and medical therapy: Part I. Circulation. 2003;108:1527–32. - PubMed
- Giugliano D, Marfella R, Verrazzo G, Acampora R, Donzella C, Quatraro A, Coppola L, D’Onofrio F. Abnormal rheologic effects of glyceryl trinitrate in patients with non-insulin-dependent diabetes mellitus and reversal by antioxidants. Ann Intern Med. 1995;123:338–43. - PubMed
Publication types
MeSH terms
Substances
Grants and funding
- R01 HL031069/HL/NHLBI NIH HHS/United States
- R37 HL031069/HL/NHLBI NIH HHS/United States
- R01 HL066331/HL/NHLBI NIH HHS/United States
- R01 HL031069-24/HL/NHLBI NIH HHS/United States
- R01 HL085352/HL/NHLBI NIH HHS/United States
- R01 HL085352-03/HL/NHLBI NIH HHS/United States
- R01 HL066331-08/HL/NHLBI NIH HHS/United States
- P01 HL043023/HL/NHLBI NIH HHS/United States
- HL43023/HL/NHLBI NIH HHS/United States
- R01HL085352/HL/NHLBI NIH HHS/United States
- HL31069/HL/NHLBI NIH HHS/United States
- HL66331/HL/NHLBI NIH HHS/United States
- P01 HL043023-180002/HL/NHLBI NIH HHS/United States
- R01 HL132574/HL/NHLBI NIH HHS/United States
LinkOut - more resources
Full Text Sources
Medical
Molecular Biology Databases
Miscellaneous


