Classification of NPY-expressing neocortical interneurons - PubMed (original) (raw)
Comparative Study
Classification of NPY-expressing neocortical interneurons
Anastassios Karagiannis et al. J Neurosci. 2009.
Abstract
Neuropeptide Y (NPY) is an abundant neuropeptide of the neocortex involved in numerous physiological and pathological processes. Because of the large electrophysiological, molecular, and morphological diversity of NPY-expressing neurons their precise identity remains unclear. To define distinct populations of NPY neurons we characterized, in acute slices of rat barrel cortex, 200 cortical neurons of layers I-IV by means of whole-cell patch-clamp recordings, biocytin labeling, and single-cell reverse transcriptase-PCR designed to probe for the expression of well established molecular markers for cortical neurons. To classify reliably cortical NPY neurons, we used and compared different unsupervised clustering algorithms based on laminar location and electrophysiological and molecular properties. These classification schemes confirmed that NPY neurons are nearly exclusively GABAergic and consistently disclosed three main types of NPY-expressing interneurons. (1) Neurogliaform-like neurons exhibiting a dense axonal arbor, were the most frequent and superficial, and substantially expressed the neuronal isoform of nitric oxide synthase. (2) Martinotti-like cells characterized by an ascending axon ramifying in layer I coexpressed somatostatin and were the most excitable type. (3) Among fast-spiking and parvalbumin-positive basket cells, NPY expression was correlated with pronounced spike latency. By clarifying the diversity of cortical NPY neurons, this study establishes a basis for future investigations aiming at elucidating their physiological roles.
Figures
Figure 1.
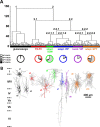
Unsupervised clustering of neocortical neurons based on laminar location and electrophysiological and molecular properties. A, Ward's clustering applied to a sample of 200 neurons. The _x_-axis represents individual cells, and the _y_-axis represents the average Euclidian within-cluster linkage distance. Glutamatergic neurons (cluster 1, black) and GABAergic neurons (cluster 2) were segregated into two first-order clusters. GABAergic neurons further subdivide into five higher-order clusters termed FS-PV (red, cluster 2.1), adapting SOM (green, cluster 2.2.1.1), adapting VIP (blue, cluster 2.2.1.2), bursting VIP (purple, cluster 2.2.2.1), and adapting NPY (orange, cluster 2.2.2.2). Bottom pie charts show, in each cluster, the proportion of neurons expressing NPY (light gray), NOS-1 (black), and neurons coexpressing NPY and NOS-1 (dark gray). B, Examples of Neurolucida reconstructions displaying the dominant morphologies of each cluster: spiny stellate cell (a1), pyramidal cell (a2), and star pyramidal cell (a3) for the glutamatergic cluster and multipolar basket cells (a4, a5), layer I targeting Martinotti-like cell (a6), bipolar cells (a7, a8), and neurogliaform-like cells (a9, a10).
Figure 2.
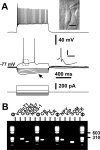
Electrophysiological and molecular analysis of FS-PV neurons. A, Current-clamp recordings of an FS-PV neuron obtained in response to application of current pulses (bottom traces) of −100, −80, −60, −40, −20, +120, and + 690 pA. Note the very long latency of fast action potentials induced by a just-above-threshold current pulse (120 pA; middle trace). Top inset, IR videomicroscopy picture of the same neuron that presented a large and radially oriented soma, pial surface is upward (scale bar, 10 μm) (see also Fig. 1_B_, a5). Bottom inset, Details of the repolarization phase of the first spike (calibration: 5 mV, 50 ms). Note the large and fast component AHP. Strong depolarizing current (690 pA; top trace) evoked a high and sustained firing rate. B, Agarose gel analysis of the RT-mPCR products of the same FS-PV neuron expressing GAD65, GAD67, PV, and NPY. C, Current-clamp recordings of another FS-PV neuron obtained in response to application of current pulses (bottom traces) of −100, −80, −60, −40, −20, +110, and + 650 pA. Note the short delay of nonadapting fast action potentials induced by a just-above-threshold current pulse (110 pA; middle trace). Top inset, IR videomicroscopy picture of the same neuron that presented a small and radially oriented soma, pial surface is upward (scale bar, 10 μm). Bottom inset, Details of the repolarization phase of the first spike (calibration: 5 mV, 50 ms). Note the large and fast single component AHP. Large depolarizing current (650 pA; top trace) evoked a high and sustained firing rate. D, Agarose gel analysis of the RT-mPCR products of the same FS-PV neuron expressing GAD65, GAD67, CB, and PV.
Figure 3.
Electrophysiological and molecular analysis of an adapting SOM neuron. A, Voltage responses induced by injection of current pulses (bottom traces) of −100, −80, −60, −40, −20, +50, and + 200 pA. Note the pronounced voltage sag after the initial peak response to hyperpolarizing current pulses (bottom middle traces, arrow). A just-above-threshold current pulse (50 pA) induced a discharge of two action potentials (top middle trace). Top inset, IR videomicroscopy picture of the same neuron that presented a large and radially oriented soma, pial surface is upward (scale bar, 10 μm) (see also Fig. 1_B_, a6). Bottom inset, Details of the repolarization phase of the first spike (calibration: 5 mV, 50 ms). Note the complex AHP consisting of a first component AHP, an ADP, and a second component AHP. Application of a large depolarizing current (200 pA) induced a discharge of action potentials with a marked frequency adaptation and a monotonous amplitude accommodation (top trace). B, Molecular analysis of the same neuron expressing GAD65, GAD67, CB, NPY, and SOM.
Figure 4.
Electrophysiological and molecular analysis of two adapting NPY neurons. A, Current-clamp recordings obtained in response to application of current pulses (bottom traces) of −100, −80, −60, −40, −20, +40, and +200 pA. Just-above-threshold current (40 pA) induced the delayed firing of action potentials (middle trace). Top inset, IR videomicroscopy picture of the same neuron that presented a radially oriented soma, pial surface is upward (scale bar, 10 μm). Bottom inset, Details of the complex repolarization phase of the first action potential (calibration: 5 mV, 50 ms) consisting of a first and a second component AHP separated by a small ADP. Larger current pulse (200 pA) evoked a pronounced frequency adaptation and amplitude accommodation (top trace, asterisk). B, RT-mPCR analysis showing expression of GAD65, GAD67, NOS-1, and NPY. C, Voltage responses evoked by injection of currents (bottom traces) of −100, −80, −60, −40, −20, +40, and + 350 pA. Just-above-threshold current (40 pA) induced the firing of action potentials with complex repolarization (middle trace). Top inset, IR videomicroscopy picture of the same neuron that presented a small and radially oriented soma, pial surface is upward (scale bar, 10 μm) (see also Fig. 1_B_, a10). Bottom inset, Details of the complex repolarization of the first spike (calibration: 5 mV, 50 ms) consisting of a fast and a slow component separated by a small ADP. Larger current pulse (350 pA) evoked a pronounced frequency adaptation and amplitude accommodation (top trace, asterisk). D, RT-mPCR analysis showing expression of GAD65, GAD67, and NPY in the neuron shown in C.
Figure 5.
Electrophysiological and molecular analysis of glutamatergic neurons. A, Current-clamp recordings of an adapting cell obtained in response to application of current pulses (bottom traces) of −100, −80, −60, −40, −20, +40 and, +210 pA. In response to just-above-threshold current pulse (40 pA), this adapting neuron fired action potentials with little frequency adaptation (middle trace). Top inset, IR videomicroscopy picture of the same neuron that presented a small and round soma, pial surface is upward (scale bar, 10 μm). Bottom inset, Details of the repolarization phase of the first spike (calibration: 5 mV, 50 ms) disclosing a biphasic AHP (dotted line) consisting of a first and second component. Injection of a large depolarizing current (210 pA; top trace) induced a pronounced frequency adaptation and a transient reduction of action potential amplitude (accommodation amplitude, asterisk). B, Agarose gel analysis of the RT-mPCR products of the same regular spiking neuron expressing vGluT1. The band migrating above 600 bp corresponds to unspecific amplification. C, Voltage response of a bursting neuron evoked by current pulses (bottom traces) of −100, −80, −60, −40, −20, +40, and +100 pA. Note the pronounced voltage sag after the initial peak response to hyperpolarizing current pulses (middle traces, arrow). In response to just-above-threshold current pulse (40 pA; top middle trace), this bursting cell discharged a burst of two action potentials on a depolarizing hump. Top inset, IR videomicroscopy picture of the same neuron that presented a small and round soma, pial surface is upward (scale bar, 10 μm). Bottom inset, Details of the repolarization phase of the two first spikes showing a simple and a biphasic AHP (dotted line) for the first and the second spike, respectively (calibration: 5 mV, 50 ms). Application of a larger depolarizing current (100 pA) induced an initial burst followed by single spikes (top trace). Note the pronounced transient reduction of spikes amplitude (asterisk). D, RT-mPCR analysis showing expression of vGluT1 in the neuron presented in C.
Figure 6.
Electrophysiological and molecular analysis of an adapting VIP and a bursting VIP neuron. A, Current-clamp recordings obtained in response to application of current pulses (bottom traces) of −100, −80, −60, −40, −20, +20, and +80 pA. Just-above-threshold current pulse (20 pA) induced discharge of action potential with a complex repolarization phase (middle trace) consisting of a sharp first component AHP, followed by an ADP and a second component AHP. Top inset, IR videomicroscopy picture of the same neuron that presented a radially oriented soma, pial surface is upward (scale bar, 10 μm). Bottom inset, Details of the AHP of the first spike (calibration: 5 mV, 50 ms). Application of a larger depolarizing current (80 pA) induced frequency adaptation and amplitude accommodation (top trace, asterisk). B, Agarose gel analysis of the RT-mPCR products of the same adapting VIP neuron expressing GAD67 and VIP. C, Voltage responses induced by injection of current pulses (bottom traces) of −100, −80, −60, −40, −20, +30, and +100 pA. Strong hyperpolarizing current (−100 pA) triggered the emission of a low threshold spike (middle trace, arrow). Just-above-threshold current pulse (30 pA) induced a burst of two spikes on a depolarizing hump (top middle trace). Top inset, IR videomicroscopy picture of the same neuron that presented a radially oriented soma, pial surface is upward (scale bar, 10 μm) (see also Fig. 1_B_, a8). Bottom inset, Details of the repolarization phase of the first two spikes (calibration: 5 mV, 50 ms). Note that the first action potential was followed by a single component AHP contrarily to second spike, which displayed complex AHP. Application of a larger depolarizing current (100 pA) induced a marked frequency adaptation with pronounced amplitude accommodation (top trace, asterisk). D, Molecular analysis of the same bursting VIP neuron expressing vGluT1, GAD65, GAD67, CB, PV, and VIP.
Figure 7.
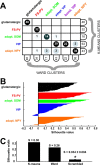
Comparison of clustering algorithms. A, The clustering generated by K means for K = 7 (3 glutamatergic clusters merged) is mostly consistent with the reference Ward's clustering but lacks a distinction between bursting VIP and adapting VIP subtypes. This is shown by this matching table, describing the intersection relations between K-means and Ward clusters. The labels attached to columns and rows display the numbers of cells within the corresponding cluster. Entries of the table indicate how many cells of a K-means cluster are contained within a given Ward cluster. B, Silhouette plot of the K-means clustering. Vertical axis, Within each cluster, cells are ranked in decreasing order of their silhouette values. This provides a graphical representation of the compactness of each individual cluster. Horizontal axis represents the silhouette values S(i) for each individual data point (large silhouette value, data point close to its cluster centroid; negative silhouette, data point closer to the centroid of a different cluster; see Materials and Methods). C, Comparison between the silhouette width for the K-means clustering and the Ward clustering of the original dataset and the average silhouette width of randomized databases. Scrambling of the dataset is associated with a consistent loss of quality in the clustering. Error bar of the scrambled silhouette width is evaluated by SD over 1000 independent randomizations.
Figure 8.
Full polythetic classification. Unsupervised clusterings of 68 neocortical interneurons based on laminar location and morphological, electrophysiological, and molecular properties. Comparison between the silhouette width for the full polythetic K-means clustering and the average silhouette width of randomized databases. Absolute and relative quality losses are shown for the cases of scrambling limited to morphological properties, to electrophysiological properties, or to molecular properties. Error bars of the scrambled silhouette width are evaluated by SD over 1000 independent randomizations.
Similar articles
- A novel functionally distinct subtype of striatal neuropeptide Y interneuron.
Ibáñez-Sandoval O, Tecuapetla F, Unal B, Shah F, Koós T, Tepper JM. Ibáñez-Sandoval O, et al. J Neurosci. 2011 Nov 16;31(46):16757-69. doi: 10.1523/JNEUROSCI.2628-11.2011. J Neurosci. 2011. PMID: 22090502 Free PMC article. - Three groups of interneurons account for nearly 100% of neocortical GABAergic neurons.
Rudy B, Fishell G, Lee S, Hjerling-Leffler J. Rudy B, et al. Dev Neurobiol. 2011 Jan 1;71(1):45-61. doi: 10.1002/dneu.20853. Dev Neurobiol. 2011. PMID: 21154909 Free PMC article. Review. - Diversity of GABAergic interneurons in layer VIa and VIb of mouse barrel cortex.
Perrenoud Q, Rossier J, Geoffroy H, Vitalis T, Gallopin T. Perrenoud Q, et al. Cereb Cortex. 2013 Feb;23(2):423-41. doi: 10.1093/cercor/bhs032. Epub 2012 Feb 22. Cereb Cortex. 2013. PMID: 22357664 - Selective coexpression of multiple chemical markers defines discrete populations of neocortical GABAergic neurons.
Kubota Y, Shigematsu N, Karube F, Sekigawa A, Kato S, Yamaguchi N, Hirai Y, Morishima M, Kawaguchi Y. Kubota Y, et al. Cereb Cortex. 2011 Aug;21(8):1803-17. doi: 10.1093/cercor/bhq252. Epub 2011 Jan 10. Cereb Cortex. 2011. PMID: 21220766 - Neocortical inhibitory system.
Druga R. Druga R. Folia Biol (Praha). 2009;55(6):201-17. Folia Biol (Praha). 2009. PMID: 20163769 Review.
Cited by
- Lineage-tracing reveals an expanded population of NPY neurons in the inferior colliculus.
Silveira MA, Herrera YN, Beebe NL, Schofield BR, Roberts MT. Silveira MA, et al. J Neurophysiol. 2024 Aug 1;132(2):573-588. doi: 10.1152/jn.00131.2024. Epub 2024 Jul 11. J Neurophysiol. 2024. PMID: 38988288 - Synaptotagmin-11 facilitates assembly of a presynaptic signaling complex in post-Golgi cargo vesicles.
Trovò L, Kouvaros S, Schwenk J, Fernandez-Fernandez D, Fritzius T, Rem PD, Früh S, Gassmann M, Fakler B, Bischofberger J, Bettler B. Trovò L, et al. EMBO Rep. 2024 Jun;25(6):2610-2634. doi: 10.1038/s44319-024-00147-0. Epub 2024 May 2. EMBO Rep. 2024. PMID: 38698221 Free PMC article. - Lineage-tracing reveals an expanded population of NPY neurons in the inferior colliculus.
Silveira MA, Herrera YN, Beebe NL, Schofield BR, Roberts MT. Silveira MA, et al. bioRxiv [Preprint]. 2024 Mar 30:2024.03.27.587042. doi: 10.1101/2024.03.27.587042. bioRxiv. 2024. PMID: 38585909 Free PMC article. Updated. Preprint. - Characterization of Sonic Hedgehog transcripts in the adult mouse brain: co-expression with neuronal and oligodendroglial markers.
Russo M, Pellegrino G, Faure H, Tirou L, Sharif A, Ruat M. Russo M, et al. Brain Struct Funct. 2024 Apr;229(3):705-727. doi: 10.1007/s00429-023-02756-2. Epub 2024 Feb 8. Brain Struct Funct. 2024. PMID: 38329543 Free PMC article. - Beyond rhythm - a framework for understanding the frequency spectrum of neural activity.
Perrenoud Q, Cardin JA. Perrenoud Q, et al. Front Syst Neurosci. 2023 Aug 31;17:1217170. doi: 10.3389/fnsys.2023.1217170. eCollection 2023. Front Syst Neurosci. 2023. PMID: 37719024 Free PMC article.
References
- Abounader R, Hamel E. Associations between neuropeptide Y nerve terminals and intraparenchymal microvessels in rat and human cerebral cortex. J Comp Neurol. 1997;388:444–453. - PubMed
- Allen YS, Adrian TE, Allen JM, Tatemoto K, Crow TJ, Bloom SR, Polak JM. Neuropeptide Y distribution in the rat brain. Science. 1983;221:877–879. - PubMed
- Ascoli GA, Alonso-Nanclares L, Anderson SA, Barrionuevo G, Benavides-Piccione R, Burkhalter A, Buzsáki G, Cauli B, Defelipe J, Fairén A, Feldmeyer D, Fishell G, Fregnac Y, Freund TF, Gardner D, Gardner EP, Goldberg JH, Helmstaedter M, Hestrin S, Karube F, et al. Petilla terminology: nomenclature of features of GABAergic interneurons of the cerebral cortex. Nat Rev Neurosci. 2008;9:557–568. - PMC - PubMed
Publication types
MeSH terms
Substances
Grants and funding
- R21 NS053684-01/NS/NINDS NIH HHS/United States
- R21NS053684/NS/NINDS NIH HHS/United States
- R21 NS053684-03/NS/NINDS NIH HHS/United States
- R21 NS053684/NS/NINDS NIH HHS/United States
- R01NS063226/NS/NINDS NIH HHS/United States
- R01 NS063226/NS/NINDS NIH HHS/United States
- R01 NS063226-01/NS/NINDS NIH HHS/United States
- R21 NS053684-02/NS/NINDS NIH HHS/United States
LinkOut - more resources
Full Text Sources
Miscellaneous


