Disrupted in schizophrenia 1 regulates neuronal progenitor proliferation via modulation of GSK3beta/beta-catenin signaling - PubMed (original) (raw)
. 2009 Mar 20;136(6):1017-31.
doi: 10.1016/j.cell.2008.12.044.
Xuecai Ge, Christopher L Frank, Jon M Madison, Angela N Koehler, Mary Kathryn Doud, Carlos Tassa, Erin M Berry, Takahiro Soda, Karun K Singh, Travis Biechele, Tracey L Petryshen, Randall T Moon, Stephen J Haggarty, Li-Huei Tsai
Affiliations
- PMID: 19303846
- PMCID: PMC2704382
- DOI: 10.1016/j.cell.2008.12.044
Disrupted in schizophrenia 1 regulates neuronal progenitor proliferation via modulation of GSK3beta/beta-catenin signaling
Yingwei Mao et al. Cell. 2009.
Abstract
The Disrupted in Schizophrenia 1 (DISC1) gene is disrupted by a balanced chromosomal translocation (1; 11) (q42; q14.3) in a Scottish family with a high incidence of major depression, schizophrenia, and bipolar disorder. Subsequent studies provided indications that DISC1 plays a role in brain development. Here, we demonstrate that suppression of DISC1 expression reduces neural progenitor proliferation, leading to premature cell cycle exit and differentiation. Several lines of evidence suggest that DISC1 mediates this function by regulating GSK3beta. First, DISC1 inhibits GSK3beta activity through direct physical interaction, which reduces beta-catenin phosphorylation and stabilizes beta-catenin. Importantly, expression of stabilized beta-catenin overrides the impairment of progenitor proliferation caused by DISC1 loss of function. Furthermore, GSK3 inhibitors normalize progenitor proliferation and behavioral defects caused by DISC1 loss of function. Together, these results implicate DISC1 in GSK3beta/beta-catenin signaling pathways and provide a framework for understanding how alterations in this pathway may contribute to the etiology of psychiatric disorders.
Figures
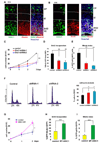
Figure 1. DISC1 regulates progenitor cell proliferation in vitro
(A) E15 embryonic brain sections were co-stained with anti-DISC1 and anti-Nestin antibody. Scale bar=20 µm. (B) E15 embryonic brain sections were co-stained with anti-DISC1 and anti-Sox2 antibody. Scale bar=20 µm. (C) Cell proliferation is reduced in AHP cells infected with lentivirus expressing DISC1 shRNAs. GFP expression is used as a marker for viral infection. Both DISC1 shRNAs significantly reduced cell proliferation (n=3, p<0.01). (D) BrdU incorporation is decreased in DISC1 knockdown cells. AHPs infected with control, DISC1 shRNA-1, or shRNA-2 lentivirus were pulse labeled with 10 µM BrdU and stained with BrdU antibody. The percentage of GFP positive cells that are also BrdU positive cells is shown (n=4, p<0.01). (E) Mitotic index is reduced in DISC1-silenced AHPs. The percentage of GFP positive cells that are also pH3 positive is shown (n=3, p<0.01). (F) Histograms for FACS analysis of N2a cells transfected with DISC1 shRNAs. Bar graph depicts the percentage of GFP positive cells in G0/G1 (n=3, p<0.01). (G) Cell proliferation is increased in DISC1 overexpressing cells. AHPs were infected with either control or DISC1-WT lentivirus. Cell number was counted for 2 days (n=3, p<0.01). (H) BrdU incorporation is increased in DISC1-overexpressing AHPs. The percentage of GFP positive cells that are also BrdU positive cells is shown (n=4, p<0.001). (I) Increased mitotic index in DISC1 overexpressing AHPs. The percentage of GFP positive cells that are also pH3 positive is shown (n=4, p<0.001).
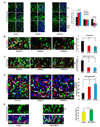
Figure 2. DISC1 regulates progenitor cell proliferation in utero
(A) DISC1 knockdown cells exhibit cell positioning defects in utero. Control or DISC1 shRNA constructs were electroporated into E13 embryonic mouse brains and the mice were sacrificed at E15. The percentage of GFP cells in each region is shown (n=4, p<0.01). Scale bar=20 µm. CP, cortical plate; IZ, intermediate zone; VZ/SVZ, ventricular zone/subventricular zone. (B) BrdU incorporation is reduced in DISC1 knockdown brains. Brains of mice electroporated at E13 were pulse labeled with BrdU (100 mg/kg) for 2 hours. Arrows indicate GFP and BrdU double positive cells. The bar graph shows the percentage of BrdU and GFP double positive cells to total GFP positive cells in SVZ (n=4, p<0.0005). Scale bar=20 µm. (C) Mitotic index of DISC1 silenced cells is reduced in utero. The percentage of GFP positive cells that are also pH3 positive in the VZ is shown (n=4, p<0.01). Scale bar=20 µm. Arrowheads indicate GFP and pH3 double positive cells. (D) DISC1 knockdown in progenitor cells causes premature cell cycle exit in utero. Control or DISC1 shRNA constructs were electroporated into E13 embryonic brains and BrdU was injected at E15. Mice were sacrificed at E16. The cell cycle exit index is measured as the percentage of the GFP-positive cells that exited the cell cycle (GFP+ BrdU+ Ki67−) divided by total GFP and BrdU double positive (GFP+ BrdU+) cells (n=5, p<0.001). Scale bar=20 µm. White arrows indicate GFP+BrdU+Ki67+ cells. Arrowheads indicate GFP+BrdU+Ki67− cells. (E) BrdU labeling is increased in DISC1 overexpressing cells in utero. Control or WT-DISC1 plasmids were electroporated into embryonic brains at E14 and BrdU was injected 2 hours before sacrificing at E15. The percentage of GFP positive cells in the SVZ that are also BrdU positive cells is shown (n=3, * p<0.05, ***p<0.005). Scale bar=10 µm.
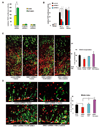
Figure 3. DISC1 regulates the β-catenin pathway
(A) DISC1 knockdown cells exhibit proliferation defects in response to Wnt3a. Transduced AHPs were grown in medium with or without Wnt3a (200 ng/ml) and cell numbers were counted for 2 days (n=3, *p<0.05, **p<0.01). (B) LEF/TCF activity (TOP) is decreased in DISC1-silenced primary neural progenitors. Luciferase activity with mutated LEF/TCF binding sites (FOP) is not affected by DISC1 shRNAs. The relative firefly luciferase activity normalized to Renilla luciferase activity is shown (n=6, p<0.01). (C) TOP activity is rescued by human WT-DISC1 expression in DISC1-silenced primary neural progenitors (n=3, p<0.01). (D) In utero TOP luciferase assay in DISC1 knockdown brains. Control or DISC1 shRNAs were coelectroporated with TOP and pRL-TK plasmids into E13 brains. Embryonic brains were harvested and subjected to luciferase assays 48 hours later. The relative TOP luciferase activity normalized to Renilla luciferase activity is shown (p<0.001). (E) TOP activity is increased in primary neural progenitors overexpressing DISC1. Shown is the relative firefly luciferase activity normalized to Renilla luciferase activity (n=3, p<0.01). (F) In utero TOP activity is increased with DISC1 overexpression. Luciferase activity is measured 24 hours after in utero electroporation (p<0.001).
Figure 4. Stable β-catenin rescues DISC1-induced defects
(A) Enhancement of TOP activity by DISC1 overexpression is abolished by β-catenin shRNAs in embryonic primary progenitors (n=6, p<0.01). (B) Vector, WT-β-catenin, or SA-β-catenin was cotransfected with the TOP reporter into embryonic progenitors transduced with lentiviruses expressing DISC1 shRNAs. Only SA-β-catenin rescued the TOP activation defect in DISC1 knockdown cells (n=4, *p<0.05, **p<0.01). (C) Cell positioning and BrdU incorporation defects caused by DISC1 loss-of-function are rescued by human WT-DISC1 or SA-β-catenin. The GFP positive cells that are also BrdU positive cells is shown as the percentage to control plus vector (n=5, **, p<0.01; ***, p<0.005). Scale bar=20 µm. (D) The reduction in mitotic index caused by DISC1 knockdown in embryonic brains is rescued by human WT-DISC1 or SA-β-catenin. Arrows indicate GFP and pH3 double positive cells. The GFP positive cells that are also pH3 positive cells is shown as the percentage to control plus vector (n=4, *, p<.0.05; ***, p<0.005). Scale bar=20 µm.
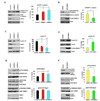
Figure 5. DISC1 regulates β-catenin stability
(A) Phosphorylation of β-catenin is increased in DISC1 silenced AHPs. Bar graph shows the percentage of relative band intensity of pS33/37/T41-β-catenin compared to control (mean±S.E.M., n=3, p<0.05) . (B) Phosphorylated β-catenin is reduced by DISC1 overexpression in AHPs. Bar graph shows the percentage of relative band intensity of pS33/37/T41-β-catenin to vector (mean±S.E.M., n=3, p<0.005) . (C) Cyclin D1 and axin2 expression are reduced in DISC1 silenced AHPs. Bar graph shows the percentage of relative band intensity of cyclin D1 to control (mean±S.E.M., n=3, *p<0.05, **p<0.01). (D) Cyclin D1 and axin2 expression is enhanced in DISC1 overexpressing AHPs. Bar graph shows the percentage of relative band intensity of cyclin D1 to vector (mean±S.E.M., n=3, p<0.05). (E) GSK3β activity increases in DISC1 knockdown cells. Lysates from transduced AHPs were immunoblotted with the anti-pY216-GSK3β, pS231/234 Ngn2, or pT220/226 C/EBPα antibodies. Bar graph shows the percentage of relative band intensity of pY216-GSK3β or pS231/234 Ngn2 to control (mean±S.E.M., n=3, p<0.01). (F) Overexpression of DISC1 suppresses GSK3β activity. Bar graph shows the percentage of relative band intensity of pY216-GSK3β or pS231/234 Ngn2to corresponding vector (mean±S.E.M., n=3, p<0.01).
Figure 6. DISC1 regulates the GSK3β signaling pathway
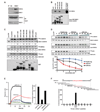
(A) DISC1 interacts with endogenous GSK3β. E14 brain lysate was subjected to immunoprecipitation with anti-HA (negative control) or anti-DISC1 antibody and immunoblotted with anti-GSK3β or DISC1 antibody. (B) GSK3β directly binds to DISC1 in vitro. Purified His-GSK3β interacts directly with DISC1 fragments 1–220aa and 356–595aa. Stars indicate the intact GST fusion proteins. (C) GSK3β activity is reduced by DISC1 GST-fragments in vitro. Numbers in the panel indicate the relative intensity of the band compared to the no protein lane (n=3). Stars indicate the different intact GST fusion proteins. (D) Inhibition of GSK3β activity by DISC1 peptide 1(195–238aa) is dose-dependent. The dose-response curve is shown (n=3, ***, p<0.005). (E) Disctide-1(195–238aa) directly binds to GSK3β Surface plasmon resonance sensorgrams for GSK3β binding assays with peptide-neg, Disctide-1, L803-mts, and a peptide from CACNA1B are shown in the left panel. The arrow indicates the injection of buffer without compound. The percent theoretical maximal response is summarized in the right hand panel for these SPR experiments. (F) Disctide2 (211–225aa) directly binds to GSK3β The schematic shows Disctide1 (mDisc aa 195–238). Each numbered line represents a 15-mer peptide (i.e. peptide2–38 – - 48) that corresponds to the DISC1 amino acids above it. The percent theoretical maximal response for SPR binding assays at 25 µM between (Disctide1 15-mers and GSK3β is summarized at the bottom of the panel. Disctide2, indicated in red, was found to bind to GSK3β.
Figure 7. GSK3β inhibitor rescues the proliferation and behavior defect caused by DISC1 knockdown in adult mice
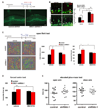
(A) Control or DISC1 shRNA-1 lentivirus was stereotactically injected into adult dentate gyrus. After 4 weeks of recovery, mice received SB216763 (2 mg/kg) every other day for 2 weeks and BrdU (100 mg/kg) daily for 7 days. The GFP signal represents lentiviral infected cells in dentate gyrus. Scale bar=50 µm. (B) DISC1 knockdown reduced adult progenitor proliferation in dentate gyrus, but this defect can be rescued by SB216763. The percentage of GFP and BrdU double positive cells is shown (n=5, *, p<.0.05; **, p<0.01; ***, p<0.005; ns, not significant). Scale bar=10 µm. (C) DISC1 knockdown in adult mice leads to hyperlocomotion in a novel environment. DISC1 knockdown mice showed ieaterg distance traveled, movement time in a novel open field, which can be reversed by SB216763 treatment (n≥8 for each group, p<0.05). (D) DISC1 knockdown in adult mice increased immobility in the forced swimming test, which was rescued by SB216763 (n≥8 for each group, **, p<0.01; ***, p<0.005). (E) No behavior changes were detected in the levated plus maze test (n=15, for each group).
Comment in
- DISC1 partners with GSK3beta in neurogenesis.
Ming GL, Song H. Ming GL, et al. Cell. 2009 Mar 20;136(6):990-2. doi: 10.1016/j.cell.2009.03.005. Cell. 2009. PMID: 19303839 Free PMC article.
Similar articles
- DISC1 partners with GSK3beta in neurogenesis.
Ming GL, Song H. Ming GL, et al. Cell. 2009 Mar 20;136(6):990-2. doi: 10.1016/j.cell.2009.03.005. Cell. 2009. PMID: 19303839 Free PMC article. - Disc1 regulates both β-catenin-mediated and noncanonical Wnt signaling during vertebrate embryogenesis.
De Rienzo G, Bishop JA, Mao Y, Pan L, Ma TP, Moens CB, Tsai LH, Sive H. De Rienzo G, et al. FASEB J. 2011 Dec;25(12):4184-97. doi: 10.1096/fj.11-186239. Epub 2011 Aug 22. FASEB J. 2011. PMID: 21859895 Free PMC article. - DISC1-dependent switch from progenitor proliferation to migration in the developing cortex.
Ishizuka K, Kamiya A, Oh EC, Kanki H, Seshadri S, Robinson JF, Murdoch H, Dunlop AJ, Kubo K, Furukori K, Huang B, Zeledon M, Hayashi-Takagi A, Okano H, Nakajima K, Houslay MD, Katsanis N, Sawa A. Ishizuka K, et al. Nature. 2011 May 5;473(7345):92-6. doi: 10.1038/nature09859. Epub 2011 Apr 6. Nature. 2011. PMID: 21471969 Free PMC article. - DISC1-related signaling pathways in adult neurogenesis of the hippocampus.
Wu Q, Li Y, Xiao B. Wu Q, et al. Gene. 2013 Apr 15;518(2):223-30. doi: 10.1016/j.gene.2013.01.015. Epub 2013 Jan 24. Gene. 2013. PMID: 23353011 Review. - The TRAX, DISC1, and GSK3 complex in mental disorders and therapeutic interventions.
Weng YT, Chien T, Kuan II, Chern Y. Weng YT, et al. J Biomed Sci. 2018 Oct 4;25(1):71. doi: 10.1186/s12929-018-0473-x. J Biomed Sci. 2018. PMID: 30285728 Free PMC article. Review.
Cited by
- Lithium rescues synaptic plasticity and memory in Down syndrome mice.
Contestabile A, Greco B, Ghezzi D, Tucci V, Benfenati F, Gasparini L. Contestabile A, et al. J Clin Invest. 2013 Jan;123(1):348-61. doi: 10.1172/JCI64650. Epub 2012 Dec 3. J Clin Invest. 2013. PMID: 23202733 Free PMC article. - Modeling psychiatric disorders at the cellular and network levels.
Brennand KJ, Simone A, Tran N, Gage FH. Brennand KJ, et al. Mol Psychiatry. 2012 Dec;17(12):1239-53. doi: 10.1038/mp.2012.20. Epub 2012 Apr 3. Mol Psychiatry. 2012. PMID: 22472874 Free PMC article. Review. - Glia and Neural Stem and Progenitor Cells of the Healthy and Ischemic Brain: The Workplace for the Wnt Signaling Pathway.
Knotek T, Janeckova L, Kriska J, Korinek V, Anderova M. Knotek T, et al. Genes (Basel). 2020 Jul 16;11(7):804. doi: 10.3390/genes11070804. Genes (Basel). 2020. PMID: 32708801 Free PMC article. Review. - DISC1 genetics, biology and psychiatric illness.
Thomson PA, Malavasi EL, Grünewald E, Soares DC, Borkowska M, Millar JK. Thomson PA, et al. Front Biol (Beijing). 2013 Feb 1;8(1):1-31. doi: 10.1007/s11515-012-1254-7. Front Biol (Beijing). 2013. PMID: 23550053 Free PMC article. - Cognitive impairment in patients with AIDS - prevalence and severity.
Watkins CC, Treisman GJ. Watkins CC, et al. HIV AIDS (Auckl). 2015 Jan 29;7:35-47. doi: 10.2147/HIV.S39665. eCollection 2015. HIV AIDS (Auckl). 2015. PMID: 25678819 Free PMC article. Review.
References
- Adachi K, Mirzadeh Z, Sakaguchi M, Yamashita T, Nikolcheva T, Gotoh Y, Peltz G, Gong L, Kawase T, Alvarez-Buylla A, et al. Beta-catenin signaling promotes proliferation of progenitor cells in the adult mouse subventricular zone. Stem Cells. 2007;25:2827–2836. - PubMed
- Beaulieu JM, Marion S, Rodriguiz RM, Medvedev IO, Sotnikova TD, Ghisi V, Wetsel WC, Lefkowitz RJ, Gainetdinov RR, Caron MG. A beta-arrestin 2 signaling complex mediates lithium action on behavior. Cell. 2008;132:125–136. - PubMed
- Beaulieu JM, Sotnikova TD, Marion S, Lefkowitz RJ, Gainetdinov RR, Caron MG. An Akt/beta-arrestin 2/PP2A signaling complex mediates dopaminergic neurotransmission and behavior. Cell. 2005;122:261–273. - PubMed
Publication types
MeSH terms
Substances
Grants and funding
- R01 NS037007/NS/NINDS NIH HHS/United States
- HHMI/Howard Hughes Medical Institute/United States
- T32 GM007753/GM/NIGMS NIH HHS/United States
- R01 NS037007-09/NS/NINDS NIH HHS/United States
- NS37007/NS/NINDS NIH HHS/United States
LinkOut - more resources
Full Text Sources
Other Literature Sources
Molecular Biology Databases
Miscellaneous
