Autophagy regulates lipid metabolism - PubMed (original) (raw)
. 2009 Apr 30;458(7242):1131-5.
doi: 10.1038/nature07976. Epub 2009 Apr 1.
Affiliations
- PMID: 19339967
- PMCID: PMC2676208
- DOI: 10.1038/nature07976
Autophagy regulates lipid metabolism
Rajat Singh et al. Nature. 2009.
Abstract
The intracellular storage and utilization of lipids are critical to maintain cellular energy homeostasis. During nutrient deprivation, cellular lipids stored as triglycerides in lipid droplets are hydrolysed into fatty acids for energy. A second cellular response to starvation is the induction of autophagy, which delivers intracellular proteins and organelles sequestered in double-membrane vesicles (autophagosomes) to lysosomes for degradation and use as an energy source. Lipolysis and autophagy share similarities in regulation and function but are not known to be interrelated. Here we show a previously unknown function for autophagy in regulating intracellular lipid stores (macrolipophagy). Lipid droplets and autophagic components associated during nutrient deprivation, and inhibition of autophagy in cultured hepatocytes and mouse liver increased triglyceride storage in lipid droplets. This study identifies a critical function for autophagy in lipid metabolism that could have important implications for human diseases with lipid over-accumulation such as those that comprise the metabolic syndrome.
Figures
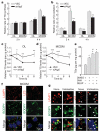
Figure 1. Inhibition of autophagy leads to increased TG accumulation
a, TG levels in hepatocytes untreated (None) or treated with 3-methyladenine (3MA) and cultured in regular medium (RM) or oleate (OL) (*P < 0.02, **P < 0.002, n = 3). b, TG levels in vector-infected (VEC) and si_Atg5_ cells in RM, OL or in MCDM (*P < 0.001, n = 5). OL values are in mM. c, TG levels in wild-type (WT) or Atg5 knockout mice embryonic fibroblasts (Atg5−/−)(*P < 0.01 or **P < 0.0001, n = 5). d–f, Cells from a and b stained with BODIPY 493/503 (d), oil red O (e) or visualized by electron microscopy (f). Right: quantifications of LD number and size (*P < 0.01, **P < 0.001 with untreated wild-type cells; #P < 0.01, ##P < 0.001 with cells in RM; n = 4–6). Nuclei are highlighted with 4,6-diamidino-2-phenylindole (DAPI; d). Error bars, s.e.m.
Figure 2. Inhibition of autophagy decreases TG β-oxidation and decay
a, b, VEC and si_Atg5_ cells cultured with oleate (OL) or in MCDM were examined for their rates of TG synthesis (a) and β-oxidation (b) as compared to cells in regular medium alone (*P < 0.03, **P < 0.004 with VEC cells in the same medium, n = 3–4). c, d, Rates of TG decay in OL (c) and MCDM (d) (*P < 0.05, **P < 0.01, ***P < 0.001 as compared to VEC cells, n = 3–7). e, TG levels in wild-type cells treated with dimethyl sulphoxide vehicle (DMSO), 3-methyladenine (3MA) or diethylumbelliferyl phosphate (DEUP) (*P < 0.00001 with DMSO-treated cells, #P < 0.003 with 3MA-treated cells, n = 6). Error bars, s.e.m. f, Co-localization of BODIPY 493/503 (green) with LAMP1 (red) or LC3 (red) in hepatocytes in MCDM. g, High-magnification regions of hepatocytes in MCDM alone (none) or treated with vinblastine and stained as labelled. Arrows indicate co-localization.
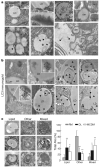
Figure 3. Lipid droplet content is delivered to lysosomes in autophagosomes
a, Electron micrographs of cultured hepatocytes. dm, double-membrane cytosolic vesicles. Arrows indicate membranes in LDs. Insets show the double membrane in nucleus (N), lipid-containing vesicles (L) and mitochondria (mit), but not in LDs. b, Mouse liver LC3 immunogold. Insets show higher magnification. Arrowheads indicate gold particles (black) and LC3-labelled bilayer membranes (white). c, Percentages of autophagic vacuoles (AVs) containing only lipid (Lipids, *), other cargo (Other) or mixed cargo (Mixed) in cells treated as in b (*P < 0.01, **P < 0.001 with cells in RM, n = 4–6). Left: representative examples. Error bars, s.e.m.
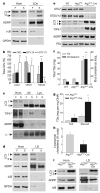
Figure 4. Effects of starvation, HFD feeding and a hepatocyte-specific blockage of autophagy on hepatic lipid accumulation
a, Immunoblots of cellular homogenates (Hom) and LDs from fed (F) or 24-h starved (S) mice. IκB, inhibitor of the nuclear factor of kappa light polypeptide gene enhancer; GPDH, glyceraldehyde-3-phosphate dehydrogenase. b, Percentages of autophagic vacuoles (AVs) containing only lipid, other cargo or mixed cargo calculated from samples processed as in Supplementary Fig. 16b (*P < 0.001, **P < 0.0001, n = 4–6). c, Immunoblots of Hom, AV and lysosomes (Lys). L-1, LAMP1. d, Immunoblots of liver Hom and LDs from HFD-fed mice. e, Liver homogenate immunoblots. PDI, protein disulphide isomerase. f, Total hepatic TG and cholesterol content (*P < 0.01, **P < 0.00001, n = 8–17). g, Hepatic TG concentration (*P < 0.05, n = 3). h, Percentage of cellular cholesterol in lysosomes (*P < 0.02, n = 4). i, Immunoblots of homogenates and isolated LDs. Error bars, s.e.m.
Comment in
- Cell biology: Another way to get rid of fat.
Zechner R, Madeo F. Zechner R, et al. Nature. 2009 Apr 30;458(7242):1118-9. doi: 10.1038/4581118a. Nature. 2009. PMID: 19407787 No abstract available. - Dropping liver fat droplets.
Kersten S, Müller M. Kersten S, et al. Hepatology. 2009 Aug;50(2):645-7. doi: 10.1002/hep.23142. Hepatology. 2009. PMID: 19642162 No abstract available.
Similar articles
- Degradation of lipid droplet-associated proteins by chaperone-mediated autophagy facilitates lipolysis.
Kaushik S, Cuervo AM. Kaushik S, et al. Nat Cell Biol. 2015 Jun;17(6):759-70. doi: 10.1038/ncb3166. Epub 2015 May 11. Nat Cell Biol. 2015. PMID: 25961502 Free PMC article. - Autophagy-lysosomal pathway is involved in lipid degradation in rat liver.
Skop V, Cahová M, Papáčková Z, Páleníčková E, Daňková H, Baranowski M, Zabielski P, Zdychová J, Zídková J, Kazdová L. Skop V, et al. Physiol Res. 2012;61(3):287-97. doi: 10.33549/physiolres.932285. Epub 2012 Apr 5. Physiol Res. 2012. PMID: 22480422 - Direct lysosome-based autophagy of lipid droplets in hepatocytes.
Schulze RJ, Krueger EW, Weller SG, Johnson KM, Casey CA, Schott MB, McNiven MA. Schulze RJ, et al. Proc Natl Acad Sci U S A. 2020 Dec 22;117(51):32443-32452. doi: 10.1073/pnas.2011442117. Epub 2020 Dec 7. Proc Natl Acad Sci U S A. 2020. PMID: 33288726 Free PMC article. - Regulation of lipid droplets by autophagy.
Dong H, Czaja MJ. Dong H, et al. Trends Endocrinol Metab. 2011 Jun;22(6):234-40. doi: 10.1016/j.tem.2011.02.003. Epub 2011 Mar 16. Trends Endocrinol Metab. 2011. PMID: 21419642 Free PMC article. Review. - Links between autophagy and lipid droplet dynamics.
Xu C, Fan J. Xu C, et al. J Exp Bot. 2022 May 13;73(9):2848-2858. doi: 10.1093/jxb/erac003. J Exp Bot. 2022. PMID: 35560198 Review.
Cited by
- Lipids associated with autophagy: mechanisms and therapeutic targets.
Jarocki M, Turek K, Saczko J, Tarek M, Kulbacka J. Jarocki M, et al. Cell Death Discov. 2024 Oct 30;10(1):460. doi: 10.1038/s41420-024-02224-8. Cell Death Discov. 2024. PMID: 39477959 Free PMC article. Review. - Balance between autophagic pathways preserves retinal homeostasis.
Rodríguez-Muela N, Koga H, García-Ledo L, de la Villa P, de la Rosa EJ, Cuervo AM, Boya P. Rodríguez-Muela N, et al. Aging Cell. 2013 Jun;12(3):478-88. doi: 10.1111/acel.12072. Epub 2013 Apr 19. Aging Cell. 2013. PMID: 23521856 Free PMC article. - Reversal of intramyocellular lipid accumulation by lipophagy and a p62-mediated pathway.
Lam T, Harmancey R, Vasquez H, Gilbert B, Patel N, Hariharan V, Lee A, Covey M, Taegtmeyer H. Lam T, et al. Cell Death Discov. 2016 Aug 22;2:16061. doi: 10.1038/cddiscovery.2016.61. eCollection 2016. Cell Death Discov. 2016. PMID: 27625792 Free PMC article. - The pivotal role of dysregulated autophagy in the progression of non-alcoholic fatty liver disease.
Shen Q, Yang M, Wang S, Chen X, Chen S, Zhang R, Xiong Z, Leng Y. Shen Q, et al. Front Endocrinol (Lausanne). 2024 Aug 8;15:1374644. doi: 10.3389/fendo.2024.1374644. eCollection 2024. Front Endocrinol (Lausanne). 2024. PMID: 39175576 Free PMC article. Review. - Autophagy deficiency in myeloid cells increases susceptibility to obesity-induced diabetes and experimental colitis.
Lee HY, Kim J, Quan W, Lee JC, Kim MS, Kim SH, Bae JW, Hur KY, Lee MS. Lee HY, et al. Autophagy. 2016 Aug 2;12(8):1390-403. doi: 10.1080/15548627.2016.1184799. Epub 2016 Jun 23. Autophagy. 2016. PMID: 27337687 Free PMC article.
References
- Martin S, Parton RG. Lipid droplets: a unified view of a dynamic organelle. Nature Rev. Mol. Cell Biol. 2006;7:373–378. - PubMed
- Zechner R, Strauss JG, Haemmerle G, Lass A, Zimmermann R. Lipolysis: pathway under construction. Curr. Opin. Lipidol. 2005;16:333–340. - PubMed
- Finn PF, Dice JF. Proteolytic and lipolytic responses to starvation. Nutrition. 2006;22:830–844. - PubMed
Publication types
MeSH terms
Substances
LinkOut - more resources
Full Text Sources
Other Literature Sources
Molecular Biology Databases


