Temporal and topographic alterations in expression of the alpha3 isoform of Na+, K(+)-ATPase in the rat freeze lesion model of microgyria and epileptogenesis - PubMed (original) (raw)
Temporal and topographic alterations in expression of the alpha3 isoform of Na+, K(+)-ATPase in the rat freeze lesion model of microgyria and epileptogenesis
Y Chu et al. Neuroscience. 2009.
Abstract
Na(+),K(+)-ATPase contributes to the asymmetrical distribution of sodium and potassium ions across the plasma membrane and to maintenance of the membrane potential in many types of cells. Alterations in this protein may play a significant role in many human neurological disorders, including epilepsy. We studied expression of the alpha3 isoform of Na(+),K(+)-ATPase in the freeze lesion (FL) microgyrus model of developmental epileptogenesis to test the hypothesis that it is downregulated following neonatal cortical injury. FL and sham-operated rat brains were examined at postnatal day (P)7, P10, P14, P21-28 and P50-60 after placement of a transcranial freeze lesion at P0 or P1. Immunohistochemistry and in situ hybridization were used to assess the expression of the alpha3 isoform of Na(+),K(+)-ATPase (termed alpha3, or alpha3 subunit below) in neuropil and the perisomatic areas of pyramidal cells and parvalbumin-containing interneurons. There was a significant decrease (P<0.05) in alpha3 subunit immunoreactivity (IR) in the neuropil of FL cortical layer V of the P14 and P21-28 groups that extended up to 360 mum from the border of the microgyrus, an area that typically exhibits evoked epileptiform activity. Alpha-3 was decreased in the perisomatic area of pyramidal but not parvalbumin-containing cells in P21-28 FL animals. A reduction in alpha3 mRNA was observed in the neuropil of FL cortical layer V up to 1610 mum from the microgyral edge. The developmental time course for expression of the alpha3 subunit between P7 and P60 was examined in naive rat cortices and results showed that there was a significant increase in alpha3 IR between P7 and P10. The significant decreases in Na(+),K(+)-ATPase in the paramicrogyral cortex may contribute to epileptogenesis.
Figures
Figure 1
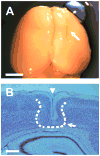
Freeze lesion microgyrus model. A: location of the lesion (white arrow) in the right cortical hemisphere of a P23 FL rat. B: Nissl stain of a coronal section through the microgyrus from the same brain (4X magnification); midline to the right. Dashed line shows the approximate edge of the microgyrus. Note the infolded cortical layers I–III comprising the microgyrus (white arrow) and the microsulcus (white arrowhead). Both images are representative of the P21–28 FL rat age group (n = 4). Scale bars are 5 mm for (A) and 500 μm for (B).
Figure 2
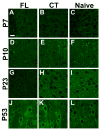
Representative confocal images of Na+/K+-ATPase α3 immunoreactivity (IR) in P7-P60 cortical layer V neuropil. A–C: Images (63×) of sections adjacent to the microgyral edge from P7 FL (n = 3), contralateral (CT) cortex (n = 3) and naive rats (n = 3). D–F: α3 IR in P10 FL (n = 3), CT cortex (n = 3) and naive animals (n = 3). G: Very weak α3 IR is detected in the neuronal processes of a P23 FL rat (n = 4). H–I: In the P21–28 CT (n = 4) and naive groups (n = 3), α3 IR is significantly more intense in neuronal processes compared to that in FL sections. J–L: In P53 sections, no detectable differences are present in α3 protein expression between FL (n = 3), CT (n = 3) and naive cortices (n = 3). Scale bar in A: 20 μm for all images.
Figure 3
Developmental time line (P7-P50) of α3 subunit IR in FL, CT and naive cortical layer V neuropil. Alpha3 IR is low at P7 in FL and control rats, but increases significantly to adult levels by P10. In both CT and naive groups, no significant changes in α3 IR are found between P10 and P50, but FL α3 levels significantly decrease between P10 and P14–28, and increase to control levels by P50. Arrow corresponds to P12, the time of reported onset of epileptiform activity. Error bars: SEM in this and subsequent Figs. *: p<0.05. FL: freeze lesioned (n = 3 for P7, P10, P14, P50–60; n = 4 for P21–28); CT: contralateral control (n = 3 for P7, P10, P14, P50–60; n = 4 for P21–28); naive (n = 3 for all age groups).
Figure 4
Alpha-3 subunit IR in P21–28 cortical layer V neuropil at various distances from the microgyral edge and in control cortices. A–D: Confocal images show a significant downregulation in α3 protein in P23 FL (63X) within the paramicrogyral zone 120 and 360 μm from the microgyral edge (A,B compared to contralateral control E,F). Normal expression levels are present at 600–840 μm (C,D compared to G,H). E–H: Topographic distribution of α3 subunit is uniform across homotopic cortical areas in contralateral hemisphere. I: Quantitative analysis of α3 IR topographic distribution in P21–28 FL, contralateral and naive cortical layer V neuropil. Graph shows significant decreases in α3 IR up to 360 μm from the microgyral edge in FL rats, in contrast to uniform levels from 120–840 μm in contralateral control and naive cortices. *: p<0.05. FL: freeze lesioned (n = 3 for P7, P10, P50–60; n = 4 for P21–28); CT: contralateral control (n = 3 for P7, P10, P50–60; n = 4 for P21–28); naive (n = 3 for all groups). Scale bar in A: 20 μm for all sections.
Figure 5
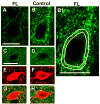
Comparison of cell somatic areas and perisomatic α3 subunit IR between FL and contralateral layer V cortices. A–B: α3 IR around representative P23 FL pyramidal neuron (A) vs. contralateral control (B). B1: Image of B, scaled ~2x showing approximate inner (yellow line) and outer boundaries (white line) of the perisomatic α3 Na+/K+-ATPase halo used to estimate somatic area and intensity of immunoreactivity per perimeter or unit length of somatic membrane (see Methods). C–D: α3 IR around parvalbumin-containing interneurons (E–F) from the same FL section as A and the same contralateral control section as B. G–H: merged images of C,E and D,F. Scale bar in A: 20 μm for A–B, B1; in C: 20 μm for C–H. Parvalbumin IR: red; α3 subunit IR: green. Quantitative data summarized in Fig. 6.
Figure 6
Quantitative analysis of perisomatic α3 IR and somatic areas between P21–28 FL and contralateral control pyramidal and parvalbumin-containing neurons. A1, B1: There were no significant differences in somatic areas of either pyramidal neurons or parvalbumin-containing interneurons between FL and control sections (A1) and (B1). A2,B2: Graphs show a significant decrease in pyramidal perisomatic α3 expression, measured per unit length of somatic membrane, in FL (A2), but not in parvalbumin-containing cells (B2). FL: freeze lesioned (n = 4); CT: contralateral control (n = 4). *: p<0.05.
Figure 7
Double immunostaining for glutamic acid decarboxylase (GAD65; A,D,G, green) and α3 Na+/K+ ATPase (B,E,H, red) in layer V of naïve cortex (A–C), paramicrogyral cortex 360 μm from microgyral edge (G–I) and cortex contralateral to microgyrus (D–F). C,F and I: Merged images of A–B, D–E and G–H, respectively. * and O mark two neurons in images A–C, D–F and G–I. J: Graph of perisomatic α3- and GAD65-IR in paramicrogyral (n = 3) and contralateral (n = 3) cortex (see Methods). *: p<0.05. Scale bars in C and I: 10 μm for A–C and D–I, respectively.
Figure 8
In-situ hybridization analysis of Na+/K+-ATPase α3 mRNA in P21–28 rat cortical layer V at various distances from the microgyral edge. A–D: α3 mRNA levels are down-regulated in FL cortex in the paramicrogyral zone compared to those in contralateral control sections. E–H: Contralateral control cortices show intense staining of α3 mRNA within the same topographic areas. The fluorescent intensity at 230 μm from the microgyral edge is much larger in control than in FL sections. I: Quantitation of α3 mRNA IR at 230 μm from the microgyral edge. Scale bar in A: 50 μm for all images. FL: freeze lesion (n = 3); CT: contralateral (n = 3); *: p<0.05.
Similar articles
- Na,K-ATPase: increases in alpha1-messenger RNA and decreases in alpha3-messenger RNA levels in aging rat cerebral cortex.
Chauhan N, Siegel G. Chauhan N, et al. Neuroscience. 1997 May;78(1):7-11. doi: 10.1016/s0306-4522(96)00642-2. Neuroscience. 1997. PMID: 9135086 - Differential expression patterns of sodium potassium ATPase alpha and beta subunit isoforms in mouse brain during postnatal development.
Sundaram SM, Safina D, Ehrkamp A, Faissner A, Heumann R, Dietzel ID. Sundaram SM, et al. Neurochem Int. 2019 Sep;128:163-174. doi: 10.1016/j.neuint.2019.04.009. Epub 2019 Apr 19. Neurochem Int. 2019. PMID: 31009649 - Na+, K+-ATPase α3 isoform in frontal cortex GABAergic neurons in psychiatric diseases.
Hodes A, Rosen H, Cohen-Ben Ami H, Lichtstein D. Hodes A, et al. J Psychiatr Res. 2019 Aug;115:21-28. doi: 10.1016/j.jpsychires.2019.04.014. Epub 2019 Apr 24. J Psychiatr Res. 2019. PMID: 31082653 - Cell biology and dynamics of Neuronal Na+/K+-ATPase in health and diseases.
Shrivastava AN, Triller A, Melki R. Shrivastava AN, et al. Neuropharmacology. 2020 Jun 1;169:107461. doi: 10.1016/j.neuropharm.2018.12.008. Epub 2018 Dec 11. Neuropharmacology. 2020. PMID: 30550795 Review. - Neuronal function and alpha3 isoform of the Na/K-ATPase.
Dobretsov M, Stimers JR. Dobretsov M, et al. Front Biosci. 2005 Sep 1;10:2373-96. doi: 10.2741/1704. Front Biosci. 2005. PMID: 15970502 Review.
Cited by
- Combined Transcriptomics, Proteomics and Bioinformatics Identify Drug Targets in Spinal Cord Injury.
Tica J, Bradbury EJ, Didangelos A. Tica J, et al. Int J Mol Sci. 2018 May 14;19(5):1461. doi: 10.3390/ijms19051461. Int J Mol Sci. 2018. PMID: 29758010 Free PMC article. - Structural alterations in fast-spiking GABAergic interneurons in a model of posttraumatic neocortical epileptogenesis.
Gu F, Parada I, Shen F, Li J, Bacci A, Graber K, Taghavi RM, Scalise K, Schwartzkroin P, Wenzel J, Prince DA. Gu F, et al. Neurobiol Dis. 2017 Dec;108:100-114. doi: 10.1016/j.nbd.2017.08.008. Epub 2017 Aug 18. Neurobiol Dis. 2017. PMID: 28823934 Free PMC article. - Progressive Brain Atrophy in Alternating Hemiplegia of Childhood.
Sasaki M, Ishii A, Saito Y, Hirose S. Sasaki M, et al. Mov Disord Clin Pract. 2017 Jan 5;4(3):406-411. doi: 10.1002/mdc3.12451. eCollection 2017 May-Jun. Mov Disord Clin Pract. 2017. PMID: 30363489 Free PMC article. - Novel mutations in ATP1A3 associated with catastrophic early life epilepsy, episodic prolonged apnea, and postnatal microcephaly.
Paciorkowski AR, McDaniel SS, Jansen LA, Tully H, Tuttle E, Ghoneim DH, Tupal S, Gunter SA, Vasta V, Zhang Q, Tran T, Liu YB, Ozelius LJ, Brashear A, Sweadner KJ, Dobyns WB, Hahn S. Paciorkowski AR, et al. Epilepsia. 2015 Mar;56(3):422-30. doi: 10.1111/epi.12914. Epub 2015 Feb 5. Epilepsia. 2015. PMID: 25656163 Free PMC article. - Reorganization of inhibitory synaptic circuits in rodent chronically injured epileptogenic neocortex.
Jin X, Huguenard JR, Prince DA. Jin X, et al. Cereb Cortex. 2011 May;21(5):1094-104. doi: 10.1093/cercor/bhq181. Epub 2010 Sep 20. Cereb Cortex. 2011. PMID: 20855494 Free PMC article.
References
- Anderson WR, Franck JE, Stahl WL, Maki AA. Na,K-ATPase is decreased in hippocampus of kainite-lesioned rats. Epilepsy Res. 1994;17:221–231. - PubMed
- Anderson TR, Huguenard JR, Prince DA. Differential effects of Na+/K+ ATPase blockade and activation in layer V neocortical neurons. Soc Neurosci Abst Program #364.15 2007
- Avanzini G, Franceschetti S, Mantegazza M. Epileptogenic channelopathies: experimental models of human pathologies. Epilepsia. 2007;S2:51–64. - PubMed
Publication types
MeSH terms
Substances
Grants and funding
- NS39579/NS/NINDS NIH HHS/United States
- NS12151/NS/NINDS NIH HHS/United States
- R01 NS039579/NS/NINDS NIH HHS/United States
- R01 NS039579-08/NS/NINDS NIH HHS/United States
- P50 NS012151/NS/NINDS NIH HHS/United States
- R56 NS039579/NS/NINDS NIH HHS/United States
- P01 NS012151-330020/NS/NINDS NIH HHS/United States
- P01 NS012151/NS/NINDS NIH HHS/United States
LinkOut - more resources
Full Text Sources
Medical
Molecular Biology Databases
Research Materials


