SIRT5 Deacetylates carbamoyl phosphate synthetase 1 and regulates the urea cycle - PubMed (original) (raw)
SIRT5 Deacetylates carbamoyl phosphate synthetase 1 and regulates the urea cycle
Takashi Nakagawa et al. Cell. 2009.
Abstract
Sirtuins are NAD-dependent protein deacetylases that connect metabolism and aging. In mammals, there are seven sirtuins (SIRT1-7), three of which are associated with mitochondria. Here, we show that SIRT5 localizes in the mitochondrial matrix and interacts with carbamoyl phosphate synthetase 1 (CPS1), an enzyme, catalyzing the initial step of the urea cycle for ammonia detoxification and disposal. SIRT5 deacetylates CPS1 and upregulates its activity. During fasting, NAD in liver mitochondria increases, thereby triggering SIRT5 deacetylation of CPS1 and adaptation to the increase in amino acid catabolism. Indeed, SIRT5 KO mice fail to upregulate CPS1 activity and show elevated blood ammonia during fasting. Similar effects occur during long-term calorie restriction or a high protein diet. These findings demonstrate SIRT5 plays a pivotal role in ammonia detoxification and disposal by activating CPS1.
Figures
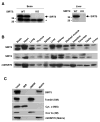
Figure 1. SIRT5 is broadly expressed and localized in the mitochondrial matrix
(A) The SIRT5 antibody specificity was tested by western blotting of mouse total brain (left) and mouse liver mitochondria matrix (right) lysates from SIRT5 wild type and KO mice. Arrow indicates SIRT5 and asterisk indicates non-specific band. (B) Total tissue lysates were subject to western blotting using anti-SIRT5, anti-SIRT4 and anti-mtHSP70 antibodies. (C) Mitochondria were isolated from mice liver and subject to sub-mitochondrial fractionation. Blots are probed with antibodies to SIRT5, Tom20 - an outer membrane (OM) marker, Cytochrome c - an inter membrane space (IMS) marker, COX Va - an inner membrane (IM) marker and mtHSP70, a matrix marker.
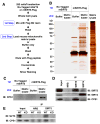
Figure 2. SIRT5 interacts with CPS1
(A) Strategy for in vitro Flag affinity purification. 293T cells were transfected with non-tagged SIRT5 or Flag-tagged SIRT5 and whole cell lysates were loaded onto Flag-M2 resin columns. After columns were washed, mitochondria matrix lysate from wild-type mice or a buffer control were loaded onto columns. Then columns were washed again, eluted by Flag peptides and concentrated. (B) Samples were subjected to SDS-PAGE and silver staining. The band indicated by the red square was excised, analyzed by mass spectrometry for protein identification and determined to be CPS1. SIRT5-Flag is also indicated. (C) These same samples were western blotted using anti-CPS1 to verify the identity of the 150 kDa band. (D) Mitochondrial matrix lysates from SIRT5 wild-type were immuno-precipitated with normal rabbit serum (NRS), anti-SIRT4 or anti-SIRT5 antibody and blotted with anit-SIRT5, SIRT4 and CPS1 antibodies. (E) Mitochondrial matrix lysates from SIRT5 wild-type and SIRT5 KO mice were immuno-precipitated with normal rabbit serum (NRS) or anti-SIRT5 antibody and blotted with anit-SIRT5 and CPS1 antibodies. The two proteins are shown to interact at endogenous levels.
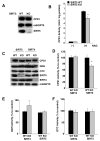
Figure 3. CPS1 activity is decreased in SIRT5 KO mice, but not in SIRT4 KO mice
(A) Liver mitochondria matrix lysates were prepared from SIRT5 KO and wild type littermate controls, and subjected to western blotting with anti-SIRT5, anti-CPS1 and anti-mtHSP70 antibodies. (B) Liver mitochondria matrix lysates from SIRT5 KO and wild type mice fed ad libitum were assayed for CPS1 activity in the presence or absence of 10mM N-acetyl glutamate (NAG), an allosteric activator. CPS1 activity is shown as unit/mg protein. Error bars represent standard deviations. (n=8 for each groups). (C) Immunoblots show SIRT5, SIRT4, GDH, CPS1, OTC and mtHSP70 protein levels in liver mitochondria matrix lysates prepared from SIRT5 KO, SIRT4 KO and their wild type littermate controls fed ad libitum. Neither SIRT KO affected the protein levels of the urea cycle enzymes or each other. (D) CPS1 activity was measured in liver mitochondria matrix lysates from SIRT4 KO, SIRT5 KO and their wild type littermate controls fed ad libitum. CPS1 activity is shown as % of wild type. Error bars represent standard deviations. (n=8 for each groups) (E) GDH activity was measured by monitoring NADH 340nm absorbance (Haigis et al., 2006). Liver mitochondria matrix lysates from SIRT4 KO, SIRT5 KO and their littermate controls fed ad libitum were assayed. GDH activity is shown as % of wild type. Error bars represent standard deviations. (n=6 for each groups) (F) OTC activity was determined by measuring converted citrulline by the colorimetric method. Liver mitochondria matrix lysates from SIRT4 KO, SIRT5 KO and their control mice fed Ad libitum were assayed. OTC activity is shown as % to control. Error bars represent standard deviations. (n=4 for each groups)
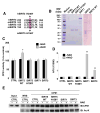
Figure 4. SIRT5 deacetylates and activates CPS1 in vitro
(A) Comparison of partial amino acid sequence between human SIRT3 (hSIRT3), mouse SIRT3 (mSIRT3), human SIRT5 (hSIRT5), and mouse SIRT5 mSIRT5). H248 in human SIRT3 is also conserved in mouse and human SIRT5 as H158. (B) Flag affinity purified mouse wild-type SIRT5-Flag (SIRT5 WT), mouse catalytic mutant SIRT5-Flag (SIRT5 H158Y), human SIRT3, human SIRT1 recombinant protein and Mock IP control were subjected to SDS-PAGE and stained with Coomasie Brilliant Blue. (C) Flag affinity purified Flag affinity purified wild-type SIRT5, catalytic mutant SIRT5 H158Y, SIRT1, SIRT3 recombinant protein or Mock IP buffer (CTRL) were assayed for deacetylation using the p53 peptide-fluorescence based SIRT1 activity assay (BIO MOL). Error bars represent standard deviations from triplicate experiments. SIRT1 is shown to deacetylate this peptide, while SIRT5 does not. (D) SIRT5 up-regulates CPS1 activity in vitro. Mitochondria matrix lysates from SIRT5 KO liver were incubated with Flag affinity purified wild-type SIRT5, catalytic mutant SIRT5 H158Y, SIRT1, SIRT3 recombinant protein or Mock IP buffer (CTRL) at 37 °C for 60 min in the presence or absence of NAD and subsequently subjected to the CPS1 activity assay. Error bars represent standard deviations from triplicate experiments. SIRT5 is shown to activate CPS1, while SIRT1 and SIRT3 does not. (E) SIRT5 specifically deacetylates CPS1 in vitro. Mitochondria matrix lysates from SIRT5 KO liver were incubated with flag affinity purified wild-type SIRT5, catalytic mutant SIRT5 (H158Y), SIRT1, SIRT3 recombinant protein or mock IP buffer (CTRL) at 37 °C for 60 min in the presence or absence of NAD and subsequently subjected to immunoprecipitation with anti-CPS1 antibody or normal rabbit serum (NRS). Immuno-precipitates were analyzed by western blotting with anti-CPS1 and anti-pan acetylated lysine (Ac-K) antibodies.
Figure 5. Starvation induces CPS1 activity in primary cultured hepatocytes
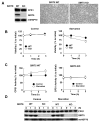
(A) Primary cultured hepatocytes were isolated from wild type and SIRT5 KO mice using the retro-perfusion technique. Hepatocytes were cultured in collagen coated 6-well plates. After 20 hours, whole cell lysates of hepatocytes were prepared and immunoblotted with anti-CPS1, anti-mtHSP70 and anti-SIRT5 antibodies (left). Images of hepatocytes from wild type and SIRT5 KO mice were taken with a Phase-contrast microscope at 100X magnification (right). (B) After 20 hours from the isolation of hepatocytes, the media were changed to DMEM (Control) or HBSS (Starvation) and cell viability was measured by Cell Titer Blue reagent at 0, 1 and 3 hours (h) thereafter. Viability is indicated as % compare to time zero. Error bars represent standard deviations from triplicate experiments. (C) Mitochondria matrix containing extracts were prepared at time 0, 1 and 3 hours (h) and assayed for CPS1 activity. Activity is shown as % of wild type at time zero. Error bars represent standard deviations from triplicate experiments. (D) Mitochondria matrix containing extracts were prepared at time 0, 1 and 3 hours (h) and blotted with anti-CPS1, anti-mtHSP70 and anti-SIRT5 antibodies.
Figure 6. Starvation and high protein diet up-regulate CPS1 activity in vivo
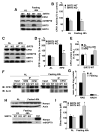
(A) Liver mitochondria matrix lysates from wild type and SIRT5 KO mice fed ad libitum or after 48 hours fasting were analyzed by western blotting using antibodies to CPS1, mtHSP70, SIRT5 and SIRT4. (B) CPS1 activity was measured in wild type and SIRT5 KO mice fed ad libitum or after 48 hours fasting. Error bars represent SEM. (n=8 for each groups). Starvation induces CPS1 activity in wild type but not SIRT5 KO mice. (C) Liver mitochondria matrix lysates in wild type and SIRT5 KO mice fed normal chow or a high protein diet for 2 weeks were analyzed by western blotting using antibodies to CPS1, mtHSP70, SIRT5 and SIRT4. CPS1 protein levels were induced by the high protein diet in both wild type and SIRT5 KO mice. (D) CPS1 activity was measured in wild type and SIRT5 KO mice fed normal chow diet or high protein diet for 2 weeks. Error bars represent SEM. (n=4 for each groups). High protein diet induces CPS1 in wild type and to a lesser degree in SIRT5 KO mice. (E) CPS1 protein levels in mitochondria matrix in wild type mice fed ad libitum or fasted for 48 hours or fed High protein diet for 2 weeks. The intensity of CPS1 band relative to mtHSP70 was analyzed by NIH ImageJ. Data were shown as % to AL control. Error bars represent SEM. (n=4 for each groups). (F) Liver mitochondria matrix lysates from wild type and SIRT5 KO mice fed ad libitum or after 48 hours fasting were immuno-precipitated with anti-CPS1 antibody or normal rabbit serum (NRS). Immuno-precipitates were analyzed by western blotting with anti-CPS1 and anti-pan acetylated lysine (Ac-K) antibodies. Fasting triggered deacetylation of CPS1 in wild type but not SIRT5 KO mice. (G) NAD and NADH concentrations in liver mitochondria from wild type mice fed ad libitum or after 48 hr fasting were measured by the enzyme cycling method. The increase in NAD but not NADH shown is the average of four independent experiments. Error bars represent standard deviations (H) Mice were fed ad libitum (AL) or starved 48-hours, and whole cell (upper) and mitochondrial (lower) extracts were blotted with antibodies to Nampt, actin and mtHSP70. Nampt was induced 2–3 fold by starvation in whole cell extracts (left), and was not associated with purified mitochondria (right). (I) Blood ammonia was measured in wild type and SIRT5 KO mice fed ad libitum or after 48 hours fasting. Error bars represent SEM. (n=8 for each groups). Starvation caused hyper-ammonemia in SIRT5 but not wild type mice.
Figure 7. Calorie restriction up-regulates CPS1 activity through deacetylation
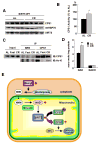
(A) Liver mitochondria matrix lysates from wild type mice fed ad libitum (AL) or 40% calorie restricted (CR) for 6 months were analyzed by western blotting using antibodies to CPS1, mtHSP70 and SIRT5. (B) CPS1 activity was measured in wild type mice fed ad libitum (AL) or 40% calorie restricted (CR) for 6 months. Error bars represent SEM. (n=4 for each groups). (C) Liver mitochondria matrix lysates from wild type mice fed ad libitum (AL), after 48 hours fasting (Fast) or 40% calorie restricted (CR) for 6 months were immuno-precipitated with anti-CPS1 antibody or normal rabbit serum (NRS). Immuno-precipitates were analyzed by western blotting with anti-CPS1 and anti pan-acetylated lysine (Ac-K) antibodies. (D) NAD and NADH concentrations in liver mitochondria from wild type mice fed ad libitum or calorie restricted were measured by the enzyme cycling method. The increase in NAD but not NADH shown is the average of four independent experiments. Error bars represent standard deviations (E) A model for the role of SIRT5 on CPS1 regulation in liver. In response to fasting, Nampt is induced in the cytosol to increase NMN levels, thereby triggering de novo NAD synthesis and SIRT5 activation in mitochondria. Activated SIRT5 deacetylates CPS1 and up-regulates the detoxification of ammonia by the urea cycle. A similar induction likely occurs during calorie restriction.
Comment in
- Ure(k)a! Sirtuins Regulate Mitochondria.
Hallows WC, Smith BC, Lee S, Denu JM. Hallows WC, et al. Cell. 2009 May 1;137(3):404-6. doi: 10.1016/j.cell.2009.04.036. Cell. 2009. PMID: 19410538 Free PMC article.
Similar articles
- Urea cycle regulation by mitochondrial sirtuin, SIRT5.
Nakagawa T, Guarente L. Nakagawa T, et al. Aging (Albany NY). 2009 Jun 29;1(6):578-81. doi: 10.18632/aging.100062. Aging (Albany NY). 2009. PMID: 20157539 Free PMC article. - Overexpression of SIRT5 confirms its involvement in deacetylation and activation of carbamoyl phosphate synthetase 1.
Ogura M, Nakamura Y, Tanaka D, Zhuang X, Fujita Y, Obara A, Hamasaki A, Hosokawa M, Inagaki N. Ogura M, et al. Biochem Biophys Res Commun. 2010 Feb 26;393(1):73-8. doi: 10.1016/j.bbrc.2010.01.081. Epub 2010 Jan 25. Biochem Biophys Res Commun. 2010. PMID: 20097174 - Ure(k)a! Sirtuins Regulate Mitochondria.
Hallows WC, Smith BC, Lee S, Denu JM. Hallows WC, et al. Cell. 2009 May 1;137(3):404-6. doi: 10.1016/j.cell.2009.04.036. Cell. 2009. PMID: 19410538 Free PMC article. - Unraveling the therapeutic potential of carbamoyl phosphate synthetase 1 (CPS1) in human diseases.
Zhang L, Zou Y, Lu Y, Li Z, Gao F. Zhang L, et al. Bioorg Chem. 2023 Jan;130:106253. doi: 10.1016/j.bioorg.2022.106253. Epub 2022 Nov 5. Bioorg Chem. 2023. PMID: 36356370 Review. - Mitochondrial sirtuins: regulators of protein acylation and metabolism.
He W, Newman JC, Wang MZ, Ho L, Verdin E. He W, et al. Trends Endocrinol Metab. 2012 Sep;23(9):467-76. doi: 10.1016/j.tem.2012.07.004. Epub 2012 Aug 16. Trends Endocrinol Metab. 2012. PMID: 22902903 Review.
Cited by
- Mitochondrial sirtuins and their relationships with metabolic disease and cancer.
Kumar S, Lombard DB. Kumar S, et al. Antioxid Redox Signal. 2015 Apr 20;22(12):1060-77. doi: 10.1089/ars.2014.6213. Epub 2015 Feb 10. Antioxid Redox Signal. 2015. PMID: 25545135 Free PMC article. Review. - Altered gene expression, mitochondrial damage and oxidative stress: converging routes in motor neuron degeneration.
Rossi L, Valle C, Carrì MT. Rossi L, et al. Int J Cell Biol. 2012;2012:908724. doi: 10.1155/2012/908724. Epub 2012 May 17. Int J Cell Biol. 2012. PMID: 22675362 Free PMC article. - SIRT5-mediated lysine desuccinylation impacts diverse metabolic pathways.
Park J, Chen Y, Tishkoff DX, Peng C, Tan M, Dai L, Xie Z, Zhang Y, Zwaans BM, Skinner ME, Lombard DB, Zhao Y. Park J, et al. Mol Cell. 2013 Jun 27;50(6):919-30. doi: 10.1016/j.molcel.2013.06.001. Mol Cell. 2013. PMID: 23806337 Free PMC article. - The secret life of NAD+: an old metabolite controlling new metabolic signaling pathways.
Houtkooper RH, Cantó C, Wanders RJ, Auwerx J. Houtkooper RH, et al. Endocr Rev. 2010 Apr;31(2):194-223. doi: 10.1210/er.2009-0026. Epub 2009 Dec 9. Endocr Rev. 2010. PMID: 20007326 Free PMC article. Review. - Comprehensive Analysis of Expression and Prognostic Value of Sirtuins in Ovarian Cancer.
Sun X, Wang S, Li Q. Sun X, et al. Front Genet. 2019 Sep 13;10:879. doi: 10.3389/fgene.2019.00879. eCollection 2019. Front Genet. 2019. PMID: 31572453 Free PMC article.
References
- Ahuja N, Schwer B, Carobbio S, Waltregny D, North BJ, Castronovo V, Maechler P, Verdin E. Regulation of insulin secretion by SIRT4, a mitochondrial ADP-ribosyltransferase. J Biol Chem. 2007;282:33583–33592. - PubMed
- Barile M, Passarella S, Danese G, Quagliariello E. Rat liver mitochondria can synthesize nicotinamide adenine dinucleotide from nicotinamide mononucleotide and ATP via a putative matrix nicotinamide mononucleotide adenylyltransferase. Biochem Mol Biol Int. 1996;38:297–306. - PubMed
- Berger F, Lau C, Dahlmann M, Ziegler M. Subcellular compartmentation and differential catalytic properties of the three human nicotinamide mononucleotide adenylyltransferase isoforms. J Biol Chem. 2005;280:36334–36341. - PubMed
- Bordone L, Cohen D, Robinson A, Motta MC, van Veen E, Czopik A, Steele AD, Crowe H, Marmor S, Luo J, et al. SIRT1 transgenic mice show phenotypes resembling calorie restriction. Aging Cell. 2007;6:759–767. - PubMed
Publication types
MeSH terms
Substances
Grants and funding
- R01 AG011119/AG/NIA NIH HHS/United States
- R01 AG011119-09/AG/NIA NIH HHS/United States
- R01 AG015339/AG/NIA NIH HHS/United States
- R01 AG015339-01A1/AG/NIA NIH HHS/United States
LinkOut - more resources
Full Text Sources
Other Literature Sources
Molecular Biology Databases
Research Materials
