Inhibitors of clathrin-dependent endocytosis enhance TGFbeta signaling and responses - PubMed (original) (raw)
Inhibitors of clathrin-dependent endocytosis enhance TGFbeta signaling and responses
Chun-Lin Chen et al. J Cell Sci. 2009.
Abstract
Clathrin-dependent endocytosis is believed to be involved in TGFbeta-stimulated cellular responses, but the subcellular locus at which TGFbeta induces signaling remains unclear. Here, we demonstrate that inhibitors of clathrin-dependent endocytosis, which are known to arrest the progression of endocytosis at coated-pit stages, inhibit internalization of cell-surface-bound TGFbeta and promote colocalization and accumulation of TbetaR-I and SARA at the plasma membrane. These inhibitors enhance TGFbeta-induced signaling and cellular responses (Smad2 phosphorylation/nuclear localization and expression of PAI-1). Dynasore, a newly identified inhibitor of dynamin GTPase activity, is one of the most potent inhibitors among those tested and, furthermore, is a potent enhancer of TGFbeta. Dynasore ameliorates atherosclerosis in the aortic endothelium of hypercholesterolemic ApoE-null mice by counteracting the suppressed TGFbeta responsiveness caused by the hypercholesterolemia, presumably acting through its effect on TGFbeta endocytosis and signaling in vascular cells.
Figures
Fig. 1.
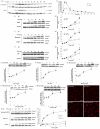
Enhancement of TGFβ-stimulated Smad2 phosphorylation and nuclear localization by clathrin-dependent endocytosis inhibitors in Mv1Lu cells. (A-I,K) Cells were pretreated with 10 mg/ml β-CD (A,K), 20 μM MDC (B), 40 μM monensin (C), 20 μM TFP (D) and 0.45 M sucrose (K) or several concentrations (as indicated) of β-CD (E), TFP (F), monensin (G), chloroquine (H) and dynasore (I), at 37°C for 1 hour. The cells were then stimulated with vehicle only or 100 pM TGFβ1 (A-I) or several concentrations (as indicated) of TGFβ1 (K). At various time-points, as indicated, at 37°C, cell lysates were analysed by 7.5% SDS PAGE followed by western blot analysis using antibodies against P-Smad2 and Smad2 and chemiluminescence development (a or top) and quantitation by densitometry (b or bottom). The data shown (a or top) are representative of three independent experiments. The relative level of P-Smad2 was expressed as arbitrary units (A.U.) (A,B,C,D,K) (b). The relative level of P-Smad2 in cells treated with TGFβ alone was taken as 100% of control (E-I, bottom). Experiments were performed in triplicate. The data are means ± s.d. Asterisks (*) indicate results significantly higher than that in cells treated with TGFβ alone; P<0.001. (J) Cells were pretreated with 10 mg/ml β-CD (c,d) at 37°C for 1 hour. The cells were then stimulated with vehicle only (a) or with 100 pM TGFβ (b,d). After 30 minutes at 37°C, the cells were fixed and subjected to indirect immunofluorescence staining using an antibody against P-Smad2. The data shown are representative of three independent experiments. Scale bar: 5 μm.
Fig. 2.
Enhancement of colocalization and accumulation of SARA and TβR-I at the plasma membrane by inhibitors of clathrin-dependent endocytosis in Mv1Lu cells. Cells were pretreated with vehicle only or 20 μM TFP, 10 mg/ml β-CD, 40 μM dynasore (Dyn) and 200 μM chloroquine (CQ) at 37°C for 1 hour. Treated cells were then stimulated with and without 100 pM TGFβ1. After 30 minutes at 37°C, cells were fixed and analyzed by indirect immunofluorescence staining using antibody against TβR-I (panels 1-10) and SARA (panels 11-20); DAPI (nuclear) staining was also performed (panels 21-30). Merged staining is also shown (panels 31-40). Insets indicate the colocalization and accumulation of SARA and TβR-I at the plasma membrane.
Fig. 3.
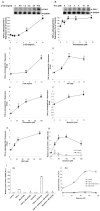
Enhancement of TGFβ-stimulated expression of PAI-1 by inhibitors of clathrin-dependent endocytosis in Mv1Lu cells. (A-G) Mv1Lu cells were pretreated with vehicle alone or with several concentrations (as indicated) of β-CD (A,C), thioridazine (B), TFP (D), chloroquine (E), monensin (F) and MDC (G) at 37°C for 1 hour. Treated cells were then stimulated with 50 pM TGFβ1. After 2 hours at 37°C, the mRNAs encoding PAI-1 and glyceraldehyde-3-phosphate dehydrogenase (G3PDH, as control) in the cell lysates were analyzed by northern blot (top) and quantified using a PhosphorImager (bottom) (A,B) or real-time RT-PCR (C-G). The TGFβ-stimulated expression of PAI-1 in cells treated with vehicle only was taken as 100% (A,B) or one fold (C-G) of control. Experiments were carried out in triplicate. The data are means ± s.d. Asterisks indicate result significantly higher than control treated without the inhibitor (*,P<0.001; **, P<0.05). (H) Mv1Lu cells were pretreated with different concentrations (as indicated) of dynasore at 37°C for 1 hour and then stimulated with 50 pM TGFβ1. After 2 hours at 37°C, the mRNAs for PAI-1 and β-actin were quantitated by real-time RT-PCR. The relative mRNA level of PAI-1:β-actin in cells treated with TGFβ1 alone was taken as 1.0 (100%). Experiments were carried out in triplicate. The data are means ± s.d. Asterisk (*) indicates result significantly higher than control treated without the inhibitor, P<0.001. (Ia) Mv1Lu cells were pretreated with SB 431542 (10 μM) at 37°C for 1 hour and dynasore (50 μM) at 37°C for 0.5 hours, alone or together, and then stimulated with and without 20 pM TGFβ1. After 2 hours at 37°C, the mRNAs for PAI-1 and β-actin were quantitated by real-time RT-PCR. The relative mRNA level of PAI-1:β-actin in cells treated with vehicle only (control) was taken as 1.0. Experiments were carried out in triplicate. The data are means ± s.d. Asterisks (*) indicates result significantly lower than cells treated with the same agent(s) but without SB 431542; P<0.001. (Ib) Mv1Lu cells stably expressing the luciferase reporter gene driven by the PAI-1 promoter (MLECs-clone 32) were pretreated with SB 431542 (10 μM) at 37°C for 1 hour and several concentrations (as indicated) of dynasore at 37°C for 0.5 hours, alone or together, and then stimulated with and without 20 pM TGFβ1 at 37°C for 6 hours. The stimulated cells were lysed in 100 μl of lysis buffer. The cell lysates were assayed using a luciferase kit (Promega). The luciferase activity (A.U.) in treated and stimulated cells was determined. Experiments were carried out in triplicate. The data are means ± s.d.
Fig. 4.
Histological analysis (A,B,C) and TβR-II and P-Smad2 immunofluorescent stainings (D,E) of the coronary arteries of wild-type and _ApoE_-null mice. Wild-type (A,D,E) and _ApoE_-null mice (A-E) were treated with DMSO only (control) (a,c) or 1 mg/kg dynasore (b,d) every two days for 8 weeks. The coronary arteries (A,D,E) and hearts (B,C) were removed from the animals and subjected to histological analysis by haematoxylin and eosin (H&E) staining (A-C) and indirect immunofluorescent staining for TβR-II (D) and P-Smad2 (E). The asterisk (*) in A, B, D and E indicates the location of the lumen in the coronary artery and descending aorta, and the small asterisks in B indicates the atherosclerotic lesions. A quantification of atherosclerotic lesion areas in descending aortas right above the aortic valves of _ApoE_-null mice (six mice per experimental group) treated with and without dynasore was performed (C). Areas of atherosclerotic lesions and blood vessel media were determined using the NIH image J program. The magnitude of the atherosclerotic lesion is presented as the percentage of lesion area/media area. The asterisk indicates a result significantly lower than the control; P<0.05 (C). The arrows and arrowheads indicate the immunofluorescent stainings of TβR-II and P-Smad2 in the aortic endothelium and smooth muscle, respectively (D,E).
Similar articles
- Differential requirement for type I and type II transforming growth factor beta receptor kinase activity in ligand-mediated receptor endocytosis.
Anders RA, Doré JJ Jr, Arline SL, Garamszegi N, Leof EB. Anders RA, et al. J Biol Chem. 1998 Sep 4;273(36):23118-25. doi: 10.1074/jbc.273.36.23118. J Biol Chem. 1998. PMID: 9722540 - Requirement of a dynein light chain in TGFbeta/Smad3 signaling.
Jin Q, Gao G, Mulder KM. Jin Q, et al. J Cell Physiol. 2009 Dec;221(3):707-15. doi: 10.1002/jcp.21910. J Cell Physiol. 2009. PMID: 19711352 Free PMC article. - Cholesterol modulates cellular TGF-beta responsiveness by altering TGF-beta binding to TGF-beta receptors.
Chen CL, Huang SS, Huang JS. Chen CL, et al. J Cell Physiol. 2008 Apr;215(1):223-33. doi: 10.1002/jcp.21303. J Cell Physiol. 2008. PMID: 17972267 Free PMC article. - Endocytic regulation of TGF-beta signaling.
Chen YG. Chen YG. Cell Res. 2009 Jan;19(1):58-70. doi: 10.1038/cr.2008.315. Cell Res. 2009. PMID: 19050695 Review. - Intracellular signaling: Fleshing out the TGFbeta pathway.
Padgett RW. Padgett RW. Curr Biol. 1999 Jun 3;9(11):R408-11. doi: 10.1016/s0960-9822(99)80255-3. Curr Biol. 1999. PMID: 10359694 Review.
Cited by
- Receptor-targeted nanoparticles modulate cannabinoid anticancer activity through delayed cell internalization.
Durán-Lobato M, Álvarez-Fuentes J, Fernández-Arévalo M, Martín-Banderas L. Durán-Lobato M, et al. Sci Rep. 2022 Jan 25;12(1):1297. doi: 10.1038/s41598-022-05301-z. Sci Rep. 2022. PMID: 35079042 Free PMC article. - Delivery of short interfering ribonucleic acid-complexed magnetic nanoparticles in an oscillating field occurs via caveolae-mediated endocytosis.
Lim J, Clements MA, Dobson J. Lim J, et al. PLoS One. 2012;7(12):e51350. doi: 10.1371/journal.pone.0051350. Epub 2012 Dec 7. PLoS One. 2012. PMID: 23236481 Free PMC article. - Soft-shelled turtle iridovirus enters cells via cholesterol-dependent, clathrin-mediated endocytosis as well as macropinocytosis.
Huang Y, Huang X, Wang S, Yu Y, Ni S, Qin Q. Huang Y, et al. Arch Virol. 2018 Nov;163(11):3023-3033. doi: 10.1007/s00705-018-3966-8. Epub 2018 Jul 31. Arch Virol. 2018. PMID: 30066272 Free PMC article. - Rab5-mediated endocytosis of activin is not required for gene activation or long-range signalling in Xenopus.
Hagemann AI, Xu X, Nentwich O, Hyvonen M, Smith JC. Hagemann AI, et al. Development. 2009 Aug;136(16):2803-13. doi: 10.1242/dev.034124. Epub 2009 Jul 15. Development. 2009. PMID: 19605501 Free PMC article. - Clathrin-mediated entry and cellular localization of chlorotoxin in human glioma.
Wiranowska M, Colina LO, Johnson JO. Wiranowska M, et al. Cancer Cell Int. 2011 Aug 12;11:27. doi: 10.1186/1475-2867-11-27. Cancer Cell Int. 2011. PMID: 21838899 Free PMC article.
References
- Boensch, C., Huang, S. S., Connolly, D. T. and Huang, J. S. (1999). Cell surface retention sequence binding protein-1 interacts with the v-sis gene product and platelet-derived growth factor beta-type receptor in simian sarcoma virus-transformed cells. J. Biol. Chem. 274, 10582-10589. - PubMed
- Chen, C. L., Huang, S. S. and Huang, J. S. (2006). Cellular heparan sulfate negatively modulates transforming growth factor-β responsiveness in epithelial cells. J. Biol. Chem. 281, 11506-11514. - PubMed
Publication types
MeSH terms
Substances
LinkOut - more resources
Full Text Sources
Other Literature Sources
Miscellaneous


