The development and function of regulatory B cells expressing IL-10 (B10 cells) requires antigen receptor diversity and TLR signals - PubMed (original) (raw)
The development and function of regulatory B cells expressing IL-10 (B10 cells) requires antigen receptor diversity and TLR signals
Koichi Yanaba et al. J Immunol. 2009.
Abstract
Autoimmunity and inflammation are controlled in part by regulatory B cells, including a recently identified IL-10-competent CD1d(high)CD5(+) B cell subset termed B10 cells that represents 1-3% of adult mouse spleen B cells. In this study, pathways that influence B10 cell generation and IL-10 production were identified and compared with previously described regulatory B cells. IL-10-competent B cells were predominantly CD1d(high)CD5(+) in adult spleen and were the prevalent source of IL-10, but not other cytokines. B10 cell development and/or maturation in vivo required Ag receptor diversity and intact signaling pathways, but not T cells, gut-associated flora, or environmental pathogens. Spleen B10 cell frequencies were significantly expanded in aged mice and mice predisposed to autoimmunity, but were significantly decreased in mouse strains that are susceptible to exogenous autoantigen-induced autoimmunity. LPS, PMA, plus ionomycin stimulation in vitro for 5 h induced B10 cells to express cytoplasmic IL-10. However, prolonged LPS or CD40 stimulation (48 h) induced additional adult spleen CD1d(high)CD5(+) B cells to express IL-10 following PMA plus ionomycin stimulation. Prolonged LPS or CD40 stimulation of newborn spleen and adult blood or lymph node CD1d(low) and/or CD5(-) B cells also induced cytoplasmic IL-10 competence in rare B cells, with CD40 ligation uniformly inducing CD5 expression. IL-10 secretion was induced by LPS signaling through MyD88-dependent pathways, but not following CD40 ligation. LPS stimulation also induced rapid B10 cell clonal expansion when compared with other spleen B cells. Thereby, both adaptive and innate signals regulate B10 cell development, maturation, CD5 expression, and competence for IL-10 production.
Figures
Figure 1
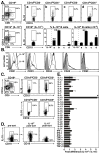
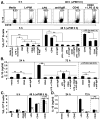
B10 cells preferentially secret IL-10. (A) IL-10-producing B cells were predominantly found within the CD1dhiCD5+CD19+ B cell subset. Splenocytes from wild type and IL-10−/− mice were cultured with L+PIM for 5 h, then stained with CD1d, CD5, and CD19 mAb before permeabilization and staining using IL-10 mAb. Percentages and bar graphs indicate mean (±SEM) B cell subset frequencies and numbers among CD19+ splenocytes or IL-10+ cell frequencies among the indicated B cell subsets (a, CD1dhiCD5−; b, CD1dhiCD5+; c, CD1dloCD5−; d, CD1dloCD5+) from 3 mice as determined by flow cytometry analysis. Values significantly different from background frequencies or numbers for IL-10−/− mice are indicated: *, p<0.05; **, p<0.01. (B) CD21, CD23, CD24, CD43, and CD93 expression by IL-10-producing (thick line) and IL-10− (thin line) CD19+ spleen B cells from wild type mice cultured with L+PIM for 5 h, then stained for cell surface antigens before permeabilization and cytoplasmic IL-10 staining. Gray histograms represent isotype-matched control mAb staining. Results are representative of those obtained with B cells from ≥3 mice as determined by flow cytometry analysis. (C) IL-10-producing B cells from hCD19Tg mice are predominantly found within the CD1dhiCD5+CD19+ B cell subset. Staining and analysis was as described in (A). (D) Representative isolation of IL-10-secreting B cells. Splenic B220+ cells purified from three hCD19Tg mice were pooled and cultured with L+PI for 5 h before staining for CD19 and secreted IL-10 capture (left panel). Cytoplasmic IL-10+ and IL-10− B cells were isolated by cell sorting using the indicated gates and subsequently reassessed for IL-10 secretion and CD19 expression (right panels). (E) Cytokine gene expression by IL-10-secreting and non-secreting B cells purified as in (D). Mean fold-differences (±SEM) in cytokine transcript levels (IL-10+/IL-10− cells) from 3 independent experiments are shown. Values of 1 (dashed line) indicate no difference in cytokine expression between the IL-10+ and IL-10− B cells, with significant differences indicated: **, p<0.005.
Figure 2
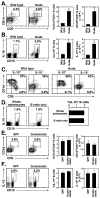
B10 cell development in neonatal and 2- or 6-mo-old wild type B6 mice. (A) Representative CD1d and CD5 expression by CD19+ B cells. Splenocytes were stained with CD1d, CD5, and CD19 mAbs with flow cytometry analysis of cells. Results represent one mouse indicating the frequency of CD1dhiCD5+ B cells among total B cells within the indicated gates. Bar graphs indicate mean (±SEM) percentages and numbers of CD1dhiCD5+ B cells in one of two independent experiments with three mice in each group. (B) IL-10 production by B cells. Splenocytes were cultured with L+PIM for 5 h, then stained with CD19 mAb to identify B cells, permeabilized, and stained using IL-10 mAb with flow cytometry analysis. Representative results demonstrate the frequency of IL-10-producing cells among total CD19+ B cells within the indicated gates. Bar graphs indicate mean (±SEM) percentages and numbers of B cells that produced IL-10 in one of two independent experiments with three mice in each group. (A, B) Significant differences between sample means are indicated: *p<0.05, **, p<0.01. (C) Representative CD1d and CD5 expression by IL-10+ or IL-10− B cells from neonatal mice. Horizontal and vertical gates delineate background staining using unreactive isotype-matched control mAbs.
Figure 3
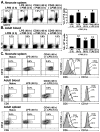
B10 cell development in T cell-deficient and gnotobiotic mice. (A) CD1d and CD5 expression by spleen CD19+ B cells from 2 mo-old wild type and nude mice. Results represent one mouse indicating the frequency of CD1dhiCD5+ B cells within the indicated gates among total B cells. Bar graphs indicate mean (±SEM) percentages and numbers of CD1dhiCD5+ B cells in one of two independent experiments with three mice in each group. (B) IL-10 production by B cells from wild type and nude mice. Splenocytes were cultured with L+PIM for 5 h, stained with CD19 mAb, permeabilized, and stained using IL-10 mAb with flow cytometry analysis. Representative results demonstrate the frequency of IL-10-producing cells within the indicated gates among total CD19+ B cells. Bar graphs indicate mean (±SEM) percentages and numbers of B cells that produced IL-10 in one of two independent experiments with three mice in each group. (C) CD1d and CD5 expression by IL-10+ or IL-10− B cells from wild type and nude mice. Data are representative of 2 independent experiments with three mice in each group. Horizontal and vertical gates delineate background staining using unreactive isotype-matched control mAbs. (D) The presence of T cells during in vitro cultures does not influence B cell IL-10 production. Wild type splenocytes or purified B220+ B cells were cultured with L+PIM for 5 h, then stained with CD19 mAb, permeabilized, and stained using IL-10 mAb with flow cytometry analysis. Representative results demonstrate the frequency of IL-10-producing cells within the indicated gates among total CD19+ B cells. Bar graphs indicate mean (±SEM) percentages and numbers of B cells that produced IL-10 in one of two independent experiments with three mice in each group. (E) CD1d and CD5 expression by spleen CD19+ B cells from specific pathogen free (SPF) and gnotobiotic mice. Bar graphs indicate mean (±SEM) percentages and numbers of CD1dhiCD5+ B cells in three mice. (F) IL-10 production by B cells from specific-pathogen-free (SPF) and gnotobiotic mice cultured as in (B). Bar graphs indicate mean (±SEM) percentages and numbers of B cells that produced IL-10 in three mice. (A, B, D–F) Significant differences between sample means are indicated: *p<0.05, **, p<0.01.
Figure 4
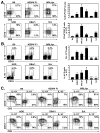
Autoimmunity promotes B10 cell expansion. (A) CD1d and CD5 expression by spleen B cells from 2 mo-old wild type B6, NZB/W F1, MRL/lpr, NOD, DBA/1, and SJL/J mice. Representative results demonstrate the frequency of CD1dhiCD5+ B cells within the indicated gates among total CD19+ B cells. Horizontal and vertical gates are set to delineate the CD1dhiCD5+ B cell subset. Bar graphs indicate mean (±SEM) percentages and numbers of CD1dhiCD5+ B cells in one of two independent experiments with 3 mice in each group. (B) IL-10 production by B cells. Splenocytes were cultured with L+PIM for 5 h, then stained with CD19 mAb, permeabilized, and stained using IL-10 mAb with flow cytometry analysis. Representative results demonstrate the frequency of IL-10-producing cells within the indicated gates among total B cells. Bar graphs indicate mean (±SEM) percentages and numbers of B cells that produced IL-10 in one of two independent experiments with 3 mice in each group. (A, B) Significant differences between sample means are indicated: *p<0.05, **, p<0.01. (C) CD1d and CD5 expression by IL-10+ or IL-10− B cells. Horizontal and vertical gates are set to delineate the CD1dhiCD5+ B cell subset as in (A). Data are representative of 2 independent experiments with 3 mice in each group.
Figure 5
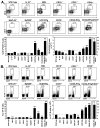
Cell surface molecules that regulate B10 cell development in vivo. (A) CD1d and CD5 expression by spleen B cells from wild type, IL-10−/−, MD4, CD19−/−, CD21−/−, CD40−/−, MHC-I/II−/−, MyD88−/−, hCD19Tg, CD22−/−, CD40L/BTg, and CD40L/BTg/CD22−/− mice. Splenocytes were stained with CD1d, CD5, and CD19 or CD20 mAbs (for CD19−/− mice). Representative results demonstrate the frequency of CD1dhiCD5+ B cells within the indicated gates among total CD19+ or CD20+ B cells. Bar graphs indicate mean (±SEM) percentages and numbers of CD1dhiCD5+ B cells in one of two independent experiments with 3 mice in each group. The horizontal dashed line is provided for reference to wild type mice. (B) IL-10 production by B cells. Splenocytes were cultured with L+PIM for 5 h, stained with CD19 or CD20 mAb, permeabilized, and stained using IL-10 mAb with flow cytometry analysis. Representative frequencies of IL-10-producing cells within the indicated gates among total CD19+ or CD20+ B cells. Bar graphs indicate mean (±SEM) percentages and numbers of B cells that produced IL-10 in one of two independent experiments with 3 mice in each group. The horizontal dashed line is for reference.
Figure 6
In vitro B cell stimulation induces IL-10 production and secretion. CD19+ splenocytes were purified from (A, B) wild type mice, or (C, D) wild type (filled bars) and MyD88−/− (open bars) littermates. Purified B cells were cultured with media alone, LPS, L+PIM, agonistic CD40 mAb, mitogenic anti-IgM Ab, or various combinations of these stimuli for the times indicated. For cytoplasmic IL-10 staining, PIM was added as indicated during the last 5 h of all cultures before the cells were isolated, stained with CD19 mAb, permeabilized, and stained with IL-10 mAb for flow cytometry analysis. (A) Values within representative histograms indicate the percentage of IL-10-producing cells within the gates shown among total B cells. Monensin was added for 5 h to media-only and LPS-only cultures. (B, D) For measuring secreted IL-10, culture supernatant fluid was harvested from cultured cells at the times indicated, with IL-10 concentrations determined by ELISA. Bar graphs indicate mean (±SEM) percentages or mean IL-10 (±SEM) concentrations from (A, B) one of 3 independent experiments with 3 mice in each group, or (C, D) one experiment with 3 mice in each group. (A–D) Significant differences between sample means are indicated: *p<0.05, **, p<0.01.
Figure 7
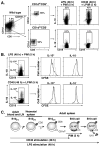
LPS and CD40 signals induce the maturation of B10 progenitor cells. LPS and CD40 mAb induce IL-10 production by (A) neonatal spleen or (B) adult blood B cells from wild type mice. (A–B) Cells were cultured with LPS, agonistic CD40 mAb, or both for the times indicated, with PIM added during the last 5 h of each culture. The cultured cells were isolated, stained with CD19 mAb, permeabilized, and stained using IL-10 mAb with flow cytometry analysis. Values within representative histograms indicate the percentage of IL-10-producing cells among CD19+ B cells within the gates shown. Bar graphs indicate mean (±SEM) percentages of IL-10 producing B cells in one of two independent experiments with 3 mice in each group. Significant differences between sample means are indicated: *p<0.05, **, p<0.01. (C) CD40 stimulation induces B cell CD5 expression. Cell surface CD1d and CD5 expression by wild type CD19+ cells was determined by immunofluorescence staining. Neonatal splenocytes, or adult blood and spleen B cells were freshly isolated, or cultured for 48 h with LPS or agonistic CD40 mAb (plus or minus LPS for the last 5 h of culture). Values indicate the percentage of CD1dhiCD5+ B cells among total B cells within the indicated gates. Single color histograms are representative of two independent experiments with 3 mice in each group.
Figure 8
Effect of LPS or CD40 ligation on IL-10 production, proliferation, and the phenotype of CD1dhiCD5+ B cells. (A) LPS and CD40 mAb-induced cytoplasmic IL-10 production are restricted to CD1dhiCD5+ B cells. CD1dhiCD5+ or CD1dloCD5− B220+ B cells were purified from pooled splenocytes of three wild type mice by cell sorting and reassessed for CD1d and CD5 expression (middle panels). The purified B cell subsets were cultured with LPS or CD40 mAb for 48 h, with L+PIM added for the last 5 h of culture before permeabilization, staining for IL-10, and flow cytometry analysis (right panels). The frequencies of IL-10+ cells among the sorted CD1dhiCD5+ or CD1dloCD5− B cell subsets are shown for one of two independent experiments. (B) Clonal expansion of IL-10-producing B cells after LPS but not CD40 stimulation in vitro for 48 h. Wild type CD19+ splenocytes were labeled with CFSE and cultured with LPS or CD40 mAb for 48 h, with L+PIM added for the last 5 h of culture. Histograms (right) represent CFSE expression by the IL-10+ or IL-10− B cell subsets. Dashed lines represent CFSE staining of unstimulated B cells. (A–B) Data are representative of 2 independent experiments. (C) Potential B10 developmental pathway leading to the generation of the IL-10 secreting B10 cell subset. Dashed arrows and question marks represent potential maturation steps based on CD5 and CD1d expression patterns.
Similar articles
- Regulatory B cells control T-cell autoimmunity through IL-21-dependent cognate interactions.
Yoshizaki A, Miyagaki T, DiLillo DJ, Matsushita T, Horikawa M, Kountikov EI, Spolski R, Poe JC, Leonard WJ, Tedder TF. Yoshizaki A, et al. Nature. 2012 Nov 8;491(7423):264-8. doi: 10.1038/nature11501. Epub 2012 Oct 14. Nature. 2012. PMID: 23064231 Free PMC article. - Blimp-1 Contributes to the Development and Function of Regulatory B Cells.
Wang YH, Tsai DY, Ko YA, Yang TT, Lin IY, Hung KH, Lin KI. Wang YH, et al. Front Immunol. 2019 Aug 14;10:1909. doi: 10.3389/fimmu.2019.01909. eCollection 2019. Front Immunol. 2019. PMID: 31474988 Free PMC article. - TLR4 supports the expansion of FasL+CD5+CD1dhi regulatory B cells, which decreases in contact hypersensitivity.
Wang K, Tao L, Su J, Zhang Y, Zou B, Wang Y, Zou M, Chen N, Lei L, Li X. Wang K, et al. Mol Immunol. 2017 Jul;87:188-199. doi: 10.1016/j.molimm.2017.04.016. Epub 2017 May 12. Mol Immunol. 2017. PMID: 28505514 - Regulatory B10 cell development and function.
Lykken JM, Candando KM, Tedder TF. Lykken JM, et al. Int Immunol. 2015 Oct;27(10):471-7. doi: 10.1093/intimm/dxv046. Epub 2015 Aug 6. Int Immunol. 2015. PMID: 26254185 Free PMC article. Review. - Regulatory B and T cell responses in patients with autoimmune thyroid disease and healthy controls.
Kristensen B. Kristensen B. Dan Med J. 2016 Feb;63(2):B5177. Dan Med J. 2016. PMID: 26836805 Review.
Cited by
- Effects of Peptide-Induced Immune Tolerance on Murine Lupus.
Singh RP, Hahn BH, Bischoff DS. Singh RP, et al. Front Immunol. 2021 May 19;12:662901. doi: 10.3389/fimmu.2021.662901. eCollection 2021. Front Immunol. 2021. PMID: 34093553 Free PMC article. - B10 cells induced by Schistosoma japonicum soluble egg antigens modulated regulatory T cells and cytokine production of T cells.
Tian F, Hu X, Xian K, Zong D, Liu H, Wei H, Yang W, Qian L. Tian F, et al. Parasitol Res. 2015 Oct;114(10):3827-34. doi: 10.1007/s00436-015-4613-x. Epub 2015 Jul 8. Parasitol Res. 2015. PMID: 26149531 - Arrest in the Progression of Type 1 Diabetes at the Mid-Stage of Insulitic Autoimmunity Using an Autoantigen-Decorated All-trans Retinoic Acid and Transforming Growth Factor Beta-1 Single Microparticle Formulation.
Phillips BE, Garciafigueroa Y, Engman C, Liu W, Wang Y, Lakomy RJ, Meng WS, Trucco M, Giannoukakis N. Phillips BE, et al. Front Immunol. 2021 Mar 8;12:586220. doi: 10.3389/fimmu.2021.586220. eCollection 2021. Front Immunol. 2021. PMID: 33763059 Free PMC article. - Local Induction of B Cell Interleukin-10 Competency Alleviates Inflammation and Bone Loss in Ligature-Induced Experimental Periodontitis in Mice.
Yu P, Hu Y, Liu Z, Kawai T, Taubman MA, Li W, Han X. Yu P, et al. Infect Immun. 2016 Dec 29;85(1):e00645-16. doi: 10.1128/IAI.00645-16. Print 2017 Jan. Infect Immun. 2016. PMID: 27795360 Free PMC article. - Leishmania infantum amastigotes trigger a subpopulation of human B cells with an immunoregulatory phenotype.
Andreani G, Ouellet M, Menasria R, Gomez AM, Barat C, Tremblay MJ. Andreani G, et al. PLoS Negl Trop Dis. 2015 Feb 24;9(2):e0003543. doi: 10.1371/journal.pntd.0003543. eCollection 2015 Feb. PLoS Negl Trop Dis. 2015. PMID: 25710789 Free PMC article.
References
- Mizoguchi A, Bhan AK. A case for regulatory B cells. J Immunol. 2006;176:705–710. - PubMed
- Serra P, Santamaria P. To ‘B’ regulated: B cells as members of the regulatory workforce. Trends Immunol. 2006;27:7–10. - PubMed
- Bouaziz JD, Yanaba K, Tedder TF. Regulatory B cells as inhibitors of immune responses and inflammation. Immunol Rev. 2008;224:201–214. - PubMed
- Mauri C, Ehrenstein MR. The ‘short’ history of regulatory B cells. Trends Immunol. 2008;29:34–40. - PubMed
Publication types
MeSH terms
Substances
Grants and funding
- AI56363/AI/NIAID NIH HHS/United States
- AI057157/AI/NIAID NIH HHS/United States
- U19 AI056363/AI/NIAID NIH HHS/United States
- CA96547/CA/NCI NIH HHS/United States
- U54 AI057157/AI/NIAID NIH HHS/United States
- CA105001/CA/NCI NIH HHS/United States
- R01 CA096547/CA/NCI NIH HHS/United States
- R01 CA105001/CA/NCI NIH HHS/United States
LinkOut - more resources
Full Text Sources
Other Literature Sources
Molecular Biology Databases
Research Materials
