Structures of three distinct activator-TFIID complexes - PubMed (original) (raw)
Structures of three distinct activator-TFIID complexes
Wei-Li Liu et al. Genes Dev. 2009.
Abstract
Sequence-specific DNA-binding activators, key regulators of gene expression, stimulate transcription in part by targeting the core promoter recognition TFIID complex and aiding in its recruitment to promoter DNA. Although it has been established that activators can interact with multiple components of TFIID, it is unknown whether common or distinct surfaces within TFIID are targeted by activators and what changes if any in the structure of TFIID may occur upon binding activators. As a first step toward structurally dissecting activator/TFIID interactions, we determined the three-dimensional structures of TFIID bound to three distinct activators (i.e., the tumor suppressor p53 protein, glutamine-rich Sp1 and the oncoprotein c-Jun) and compared their structures as determined by electron microscopy and single-particle reconstruction. By a combination of EM and biochemical mapping analysis, our results uncover distinct contact regions within TFIID bound by each activator. Unlike the coactivator CRSP/Mediator complex that undergoes drastic and global structural changes upon activator binding, instead, a rather confined set of local conserved structural changes were observed when each activator binds holo-TFIID. These results suggest that activator contact may induce unique structural features of TFIID, thus providing nanoscale information on activator-dependent TFIID assembly and transcription initiation.
Figures
Figure 1.
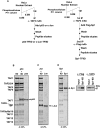
Affinity purification of stable activator/TFIID protein complexes. (A) Schematic representation of the purification procedures of activator/TFIID complexes. P53- or c-Jun-bound TFIID complexes were obtained by immunoprecipitating TFIID from the phosphocellulose 1M KCl fraction using an anti-TAF4 antibody. After extensive washing, a 10-fold molar excess amount of activators p53 or c-Jun was loaded on to the resins containing TFIID. p53- or c-Jun-bound IIDs were obtained after extensive washes followed by an elution step using a specific peptide against TAF4. For Sp1-bound TFIID, Flag-tagged Sp1 was used in the loading step. Stable Sp1-IID complexes were obtained by tandem immunoprecipitations using anti-TAF4 and anti-Flag antibodies. (B,C) Distinct activator/TFIID complexes (i.e., p53-IID and c-Jun-IID) were analyzed by 4%–12% SDS-PAGE (Invitrogen) and visualized by Flamingo Fluorescent Gel Stain (Bio-Rad) and a Typhoon imaging scanning system (GE). (D) Sp1-IID was analyzed by 4%–12% SDS-PAGE (Invitrogen) and visualized by Flamingo Fluorescent Gel Stain (Bio-Rad) and a Typhoon imaging scanning system (GE). Since Flag-tagged Sp1 comigrates with TAF5, the presence of Flag-tagged Sp1 and TAF5 of the Sp1-IID complexes in the anti-Flag eluates was detected by Western blot analysis using anti-Flag (Sigma) and anti-TAF5 antibodies. “Input” represents the anti-TAF4 eluates from the first immunoprecipitation prior to anti-Flag affinity immunoprecipitations and “Sp1-IID” represents the anti-Flag eluates.
Figure 2.
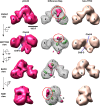
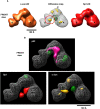
The 3D EM structure of p53-IID. 3D reconstructions of p53-IID (left), holo-TFIID (right), and a 3D density difference map (center) between p53-IID and TFIID are shown in four different views (front, bottom, back, and side). The major lobes are labeled A, B, and C, and a smaller domain labeled D lobe (see the back view). Channels within the central cavity between the A and B (ChA–B) or the B and D (ChB–D) lobes are shown with the dotted blue lines. The center column shows the difference map between p53-IID and holo-TFIID reconstructions, with solid magenta representing positive differences and mesh green representing negative differences relative to the holo-TFIID reconstructions. The gray mesh corresponds to the 3D structure of p53-IID with the A, B, C, and D lobes indicated. The most prominent difference region denoted by the red circle is located at lobe C, weakly connected to lobe A, and was interpreted as the location of the p53 protein. Two small extra density pockets are located in lobe D (back view). The missing densities in p53-IID are predominantly located at lobes A and C. Bar, 100 Å.
Figure 3.
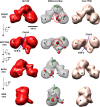
The 3D EM structure of Sp1-IID. 3D reconstructions of Sp1-IID (left), holo-TFIID (right), and 3D density difference map (center) between Sp1-IID and TFIID are shown as in Figure 2 with the major lobes and channels as previously indicated. The channel within the central cavity between lobes A and B (ChA–B) of Sp1-IID is significantly narrower than that of holo-TFIID (see bottom view). The center column shows the difference map between Sp1-IID and holo-TFIID, with solid red representing positive differences, mesh green representing negative differences with respect to the holo-TFIID reconstruction, and the gray mesh corresponding to the 3D structure of Sp1-IID. The solid red circle denotes the most significant positive difference, and is assigned as the position of Sp1 contact within TFIID. There are missing densities in Sp1-IID located at the top of lobe C and within lobe A. Bar, 100 Å.
Figure 4.
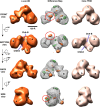
The 3D EM structure of c-Jun-IID. 3D reconstructions of c-Jun-IID (left), holo-TFIID (right), and 3D density difference map (center) between c-Jun-IID and TFIID are presented as in Figures 2 and 3. The distance within the central cavity between lobes A and B (ChA–B) of c-Jun-IID is similar to the one of holo-TFIID (bottom view). The center column shows the difference map between c-Jun-IID and holo-TFIID, with orange representing positive differences, green representing negative differences, and the gray mesh corresponding to the 3D structure of c-Jun-IID. The orange circle denotes the significant positive difference and is predicted as the position of c-Jun contact within TFIID. Two positive differences are located at the tip of Lobe D and the junction between lobes A and D. Similar to p53- and Sp1-IID, missing densities in c-Jun-IID are located at the top of lobe C and within Lobe A. Bar, 100 Å.
Figure 5.
The significance of extra density by additional density difference map analysis. (A) 3D reconstructions of c-Jun-IID (left), Sp1-IID (right), and 3D density difference map (center) of c-Jun-IID minus Sp1-IID are shown with the major lobes and channels as previously indicated in Figures 2–4. The yellow and green mesh represents positive and negative differences, respectively, with the gray mesh corresponding to the 3D structure of c-Jun-IID (shown at center). The orange circle denotes the significant positive difference on the surface of TFIID and is predicted as the position of c-Jun contact within TFIID. (B) Summed 3D density difference maps of each activator for p53-IID (top center), Sp1-IID (bottom left), and c-Jun-IID (bottom right). The summed positive density differences are shown in magenta (p53), red (Sp1), and yellow (c-Jun) and confirm the points of contact for each respective activator on TFIID. The green mesh represents the sum of the negative differences. Bar, 100 Å.
Figure 6.
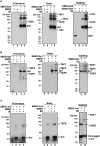
Activator contacts within TFIID by label transfer assays. Activators p53 (A), Sp1 (B), and c-Jun (C), were labeled at the N terminus (left panel, marked as N Terminus) and internal lysines (center panel, marked as body) with the heterotrifunctional SBED cross-linker. Activators and a control GST protein labeled at internal lysines were also loaded onto our TFIID affinity columns (right panel, marked as loading, lanes 9–12). Reactions containing cross-linker alone (lanes 1,2,5,6) and labeled activators/GST (lanes 3,4,7–9,11) were mixed with TFIID (lanes 2,4,6,8,10,12) and exposed to UV light. TFIID subunits that are within 21 Å of the S-SBED were covalently cross-linked to the activator. After cleaving the cross-linker with DTT, biotin was transferred from the activator to the cross-linked TFIID subunit. SDS-PAGE and immunoblotting using anti-biotin antibodies reveals TFIID subunits that contact distinct regions of the three activators. The stars represent nonspecific cross-linked bands in the blots.
Figure 7.
A representative model of distinct surfaces within TFIID that are targeted by activators. Overlay of 3D density difference maps of p53-IID/holo-TFIID, Sp1-IID/holo-TFIID, and c-Jun-IID/holo-TFIID. The holo-TFIID structure (light pink) along with positive density differences for p53 (magenta), Sp1 (red), and c-Jun (orange) are shown, suggesting the location of potential distinct activator contacts. Bar, 100 Å.
Similar articles
- New insights into the function of transcription factor TFIID from recent structural studies.
Papai G, Weil PA, Schultz P. Papai G, et al. Curr Opin Genet Dev. 2011 Apr;21(2):219-24. doi: 10.1016/j.gde.2011.01.009. Epub 2011 Mar 21. Curr Opin Genet Dev. 2011. PMID: 21420851 Free PMC article. Review. - Structural changes in TAF4b-TFIID correlate with promoter selectivity.
Liu WL, Coleman RA, Grob P, King DS, Florens L, Washburn MP, Geles KG, Yang JL, Ramey V, Nogales E, Tjian R. Liu WL, et al. Mol Cell. 2008 Jan 18;29(1):81-91. doi: 10.1016/j.molcel.2007.11.003. Mol Cell. 2008. PMID: 18206971 Free PMC article. - An acetylation switch in p53 mediates holo-TFIID recruitment.
Li AG, Piluso LG, Cai X, Gadd BJ, Ladurner AG, Liu X. Li AG, et al. Mol Cell. 2007 Nov 9;28(3):408-21. doi: 10.1016/j.molcel.2007.09.006. Mol Cell. 2007. PMID: 17996705 - TAF4 nucleates a core subcomplex of TFIID and mediates activated transcription from a TATA-less promoter.
Wright KJ, Marr MT 2nd, Tjian R. Wright KJ, et al. Proc Natl Acad Sci U S A. 2006 Aug 15;103(33):12347-52. doi: 10.1073/pnas.0605499103. Epub 2006 Aug 8. Proc Natl Acad Sci U S A. 2006. PMID: 16895980 Free PMC article. - Promoter Recognition: Putting TFIID on the Spot.
Bhuiyan T, Timmers HTM. Bhuiyan T, et al. Trends Cell Biol. 2019 Sep;29(9):752-763. doi: 10.1016/j.tcb.2019.06.004. Epub 2019 Jul 9. Trends Cell Biol. 2019. PMID: 31300188 Review.
Cited by
- Structure of the p53/RNA polymerase II assembly.
Liou SH, Singh SK, Singer RH, Coleman RA, Liu WL. Liou SH, et al. Commun Biol. 2021 Mar 25;4(1):397. doi: 10.1038/s42003-021-01934-4. Commun Biol. 2021. PMID: 33767390 Free PMC article. - Subnuclear segregation of genes and core promoter factors in myogenesis.
Yao J, Fetter RD, Hu P, Betzig E, Tjian R. Yao J, et al. Genes Dev. 2011 Mar 15;25(6):569-80. doi: 10.1101/gad.2021411. Epub 2011 Feb 28. Genes Dev. 2011. PMID: 21357673 Free PMC article. - Alternative splicing targeting the hTAF4-TAFH domain of TAF4 represses proliferation and accelerates chondrogenic differentiation of human mesenchymal stem cells.
Kazantseva J, Kivil A, Tints K, Kazantseva A, Neuman T, Palm K. Kazantseva J, et al. PLoS One. 2013 Oct 2;8(10):e74799. doi: 10.1371/journal.pone.0074799. eCollection 2013. PLoS One. 2013. PMID: 24098348 Free PMC article. - A sequence-specific transcription activator motif and powerful synthetic variants that bind Mediator using a fuzzy protein interface.
Warfield L, Tuttle LM, Pacheco D, Klevit RE, Hahn S. Warfield L, et al. Proc Natl Acad Sci U S A. 2014 Aug 26;111(34):E3506-13. doi: 10.1073/pnas.1412088111. Epub 2014 Aug 13. Proc Natl Acad Sci U S A. 2014. PMID: 25122681 Free PMC article. - New insights into the function of transcription factor TFIID from recent structural studies.
Papai G, Weil PA, Schultz P. Papai G, et al. Curr Opin Genet Dev. 2011 Apr;21(2):219-24. doi: 10.1016/j.gde.2011.01.009. Epub 2011 Mar 21. Curr Opin Genet Dev. 2011. PMID: 21420851 Free PMC article. Review.
References
- Andel F, III, Ladurner AG, Inouye C, Tjian R, Nogales E. Three-dimensional structure of the human TFIID–IIA–IIB complex. Science. 1999;286:2153–2156. - PubMed
- Brown CE, Howe L, Sousa K, Alley SC, Carrozza MJ, Tan S, Workman JL. Recruitment of HAT complexes by direct activator interactions with the ATM-related Tra1 subunit. Science. 2001;292:2333–2337. - PubMed
- Chen L, Glover JN, Hogan PG, Rao A, Harrison SC. Structure of the DNA-binding domains from NFAT, Fos and Jun bound specifically to DNA. Nature. 1998;392:42–48. - PubMed
Publication types
MeSH terms
Substances
Grants and funding
- R37 CA025417/CA/NCI NIH HHS/United States
- P01 CA112181/CA/NCI NIH HHS/United States
- HHMI/Howard Hughes Medical Institute/United States
- R01 GM063072/GM/NIGMS NIH HHS/United States
- R01 GM63072/GM/NIGMS NIH HHS/United States
LinkOut - more resources
Full Text Sources
Research Materials
Miscellaneous
