Impaired regulation of the TNF-alpha converting enzyme/tissue inhibitor of metalloproteinase 3 proteolytic system in skeletal muscle of obese type 2 diabetic patients: a new mechanism of insulin resistance in humans - PubMed (original) (raw)
. 2009 Oct;52(10):2169-81.
doi: 10.1007/s00125-009-1451-3. Epub 2009 Jul 25.
S Kamath, A O Chavez, V E Centonze, M Veerasamy, A Barrentine, J J Wewer, D K Coletta, C Jenkinson, R M Jhingan, D Smokler, S Reyna, N Musi, R Khokka, M Federici, D Tripathy, R A DeFronzo, F Folli
Affiliations
- PMID: 19633828
- PMCID: PMC2845986
- DOI: 10.1007/s00125-009-1451-3
Impaired regulation of the TNF-alpha converting enzyme/tissue inhibitor of metalloproteinase 3 proteolytic system in skeletal muscle of obese type 2 diabetic patients: a new mechanism of insulin resistance in humans
A Monroy et al. Diabetologia. 2009 Oct.
Abstract
Aims/hypothesis: TNF-alpha levels are increased in obesity and type 2 diabetes. The regulation of TNF-alpha converting enzyme (TACE) and its inhibitor, tissue inhibitor of metalloproteinase 3 (TIMP3), in human type 2 diabetes is unknown.
Methods: We examined TACE/TIMP3 regulation: (1) in lean and obese normal glucose tolerant (NGT) individuals and in type 2 diabetes patients; (2) following 6 h of lipid/saline infusion in NGT individuals; and (3) in cultured human myotubes from lean NGT individuals incubated with palmitate. Insulin sensitivity was assessed by a euglycaemic clamp and TACE/TIMP3 was evaluated by confocal microscopy, RT-PCR, western blotting and an in vitro activity assay. Circulating TNF-alpha, TNF-alpha-receptor 1 (TNFR1), TNF-alpha-receptor 2 (TNFR2), IL-6 receptor (IL-6R), vascular cell adhesion molecule (VCAM) and intercellular adhesion molecule (ICAM) levels were evaluated.
Results: TIMP3 levels were reduced and TACE enzymatic activity was increased in type 2 diabetes skeletal muscle. TACE expression, and TACE, TNF-alpha, TNFR1 and IL-6R levels were increased in type 2 diabetes, and positively correlated with insulin resistance. A 6 h lipid infusion into NGT individuals decreased insulin-stimulated glucose metabolism by 25% with increased TACE, decreased expression of the gene encoding TIMP3 and increased IL-6R release. Palmitate induced a dramatic reduction of TIMP3 and increased the TACE/TIMP3 ratio in cultured myotubes.
Conclusions/interpretation: TACE activity was increased in skeletal muscle of obese type 2 diabetes patients and in lipid-induced insulin resistance. We propose that dysregulation of membrane proteolysis by TACE/TIMP3 of TNF-alpha and IL-6R is an important factor for the development of skeletal muscle insulin resistance in obese type 2 diabetes patients by a novel autocrine/paracrine mechanism.
Figures
Fig. 1
Subcellular distribution of TACE and TIMP3 in skeletal muscle of NGT individuals. a Subcellular fractionation method outline. b, c Immunoblot analysis of human skeletal muscle subcellular fractions employing anti-TACE (b) and anti-TIMP3 (c) antibodies. *p<0.05 (_n_=3–4 for b and c). Data are means ± SEM. ER, endoplasmic reticulum
Fig. 2
mRNA for TACE, and TIMP3, pro-TNF-α and TNF-α protein abundance in human skeletal muscle. a Expression of TACE was measured by quantitative real-time RT-PCR and normalised for 18S ribosomal RNA in vastus lateralis (skeletal) muscle. Relative quantification was calculated by the 2−ΔΔCt where ΔCt is Ct−18S Ct. Each reaction was done in duplicate. b Western blot analysis of TACE protein in vastus lateralis muscle. Protein was extracted from total homogenate, solubilised and separated on SDS-PAGE, transferred to nitrocellulose membranes and incubated with rabbit polyclonal anti-TACE antibody. Abundance of TIMP3 (c), pro-TNF-α (d), TNF-α (e) and β-actin (f) in vastus lateralis muscle. Data are means ± SEM. *p<0.01 vs lean, **p<0.01 vs lean, †p<0.05 vs type 2 diabetes (_n_=10–12 per group). T2DM, type 2 diabetes mellitus
Fig. 3
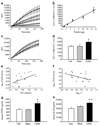
TACE activity in skeletal muscle in vitro and circulating TACE substrates in lean and obese individuals and type 2 diabetes patients. a, b TACE peptide cleavage was measured by a fluorimetric assay with different quantities of skeletal muscle protein: a relative fluorescence units (RFUs; black circles, 1 µg; white circles, 5 µg; black inverted triangles, 10 µg; white triangles, 15 µg; black squares, 30 µg); b AUCs. c TACE peptide cleavage (RFUs) at 10 µg muscle homogenate protein from lean NGT (black circles) and obese NGT individuals (white circles) and type 2 diabetes (T2DM) patients (black inverted triangles). d AUCs for TACE activity in vitro in lean NGT, obese NGT and type 2 diabetes patients. e, f Correlations between log10 TACE activity and NEFA (e, _r_=0.460, _r_2=0.211, _p_=0.05) and log10 TACE activity and log10 M (f, _r_=0.471, _r_2=0.222, _p_=0.036). g, h Serum concentration (measured with ELISA) of sTNFR1 (g) and sIL-6R (h) in lean NGT and obese NGT individuals and type 2 diabetic patients. Data are means ± SEM. *p<0.05, **p<0.01 (_n_=20 for TACE activity and 8–10 for sTNFR1 and sIL-6R)
Fig. 4
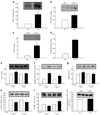
a Insulin-stimulated glucose metabolism (M value) was measured with the euglycaemic insulin clamp during saline and lipid infusion. b–f mRNA expression for TACE (b), TIMP3 (c), IR (d), IRS-1 (e) and AKT (f) was measured in human vastus lateralis (skeletal) muscle before and after a 6 h lipid or saline infusion in lean NGT individuals. g Serum concentrations of sIL-6R before and after a 2–6 h lipid infusion, and after a 2 h euglycaemic insulin 80 mU m−2 min−1 clamp. Data are means ± SEM. *p<0.05, **p<0.01, ***p<0.001, all compared with basal (_n_=10–12 individuals per group). LBM, lean body mass
Fig. 5
Expression in human myotubes of TACE (a), TIMP3 (b), TACE/TIMP3 ratio (c) and β-actin (d). *p<0.05, 200 µmol/l NEFA vs BSA control (BSA-Ctrl); **p<0.05, 400 µmol/l NEFA vs BSA. †p<0.05, 200 µmol/l NEFA vs 400 µmol/l NEFA. _n_=4–6 per group. Data are means ± SEM
Fig. 6
a TACE levels in human myotubes infected with adenovirus encoding TACE or GFP for control. b–d Increased TNF-α shedding in the presence of increased abundance of both pro-TNF-α and TNF-α. e, f AKT and phospho-AKT (Ser 473) levels in myotubes in the presence (+) and absence (−) of insulin (10 nmol/l). g, h AMPK and phospho-AMPK levels in the presence (+) and absence (−) of insulin. i Phospho-ACC levels in human myotubes in the presence (+) or absence (−) of insulin. *p<0.05 vs GFP and absence of insulin; **p< 0.01 vs GFP. _n_=4–6 per group. Data are means ± SEM. j β-Actin as a protein loading control for pro-TNF-α and TNF-α levels. _n_=4 per group. Data are means ± SEM. Values are expressed as a percentage of control
Similar articles
- Pioglitazone improves glucose metabolism and modulates skeletal muscle TIMP-3-TACE dyad in type 2 diabetes mellitus: a randomised, double-blind, placebo-controlled, mechanistic study.
Tripathy D, Daniele G, Fiorentino TV, Perez-Cadena Z, Chavez-Velasquez A, Kamath S, Fanti P, Jenkinson C, Andreozzi F, Federici M, Gastaldelli A, Defronzo RA, Folli F. Tripathy D, et al. Diabetologia. 2013 Oct;56(10):2153-63. doi: 10.1007/s00125-013-2976-z. Epub 2013 Jun 30. Diabetologia. 2013. PMID: 23811853 Clinical Trial. - TACE inhibition amplifies TNF-alpha-mediated colonic epithelial barrier disruption.
Fréour T, Jarry A, Bach-Ngohou K, Dejoie T, Bou-Hanna C, Denis MG, Mosnier JF, Laboisse CL, Masson D. Fréour T, et al. Int J Mol Med. 2009 Jan;23(1):41-8. Int J Mol Med. 2009. PMID: 19082505 - 4-Hydroxyisoleucine ameliorates an insulin resistant-like state in 3T3-L1 adipocytes by regulating TACE/TIMP3 expression.
Gao F, Du W, Zafar MI, Shafqat RA, Jian L, Cai Q, Lu F. Gao F, et al. Drug Des Devel Ther. 2015 Oct 20;9:5727-36. doi: 10.2147/DDDT.S92355. eCollection 2015. Drug Des Devel Ther. 2015. PMID: 26527864 Free PMC article. - The role of ADAM17 in metabolic inflammation.
Menghini R, Fiorentino L, Casagrande V, Lauro R, Federici M. Menghini R, et al. Atherosclerosis. 2013 May;228(1):12-7. doi: 10.1016/j.atherosclerosis.2013.01.024. Epub 2013 Jan 25. Atherosclerosis. 2013. PMID: 23384719 Review.
Cited by
- Synergistic effects of glucose tolerance and BMI on cardiovascular events and all-cause mortality in a healthy population: CA.ME.LI.A study 7 years follow-up.
Bignotto M, Bianco E, Centofanti L, Russo A, Dei Cas M, Zermiani P, Morano C, Samartin F, Bertolini E, Bifari F, Berra C, Zuin M, Paroni R, Battezzati PM, Folli F. Bignotto M, et al. Am J Physiol Endocrinol Metab. 2024 Oct 1;327(4):E498-E511. doi: 10.1152/ajpendo.00181.2024. Epub 2024 Aug 28. Am J Physiol Endocrinol Metab. 2024. PMID: 39196799 Free PMC article. - Role of Metalloproteinases in Diabetes-associated Mild Cognitive Impairment.
Pereira VM, Pradhanang S, Prather JF, Nair S. Pereira VM, et al. Curr Neuropharmacol. 2024;23(1):58-74. doi: 10.2174/1570159X22666240517090855. Curr Neuropharmacol. 2024. PMID: 38963109 Review. - TACE inhibition: a promising therapeutic intervention against AATF-mediated steatohepatitis to hepatocarcinogenesis.
Srinivas AN, Suresh D, Vishwanath PM, Satish S, Santhekadur PK, Koka S, Kumar DP. Srinivas AN, et al. Mol Oncol. 2024 Aug;18(8):1940-1957. doi: 10.1002/1878-0261.13646. Epub 2024 Apr 1. Mol Oncol. 2024. PMID: 38558505 Free PMC article. - The Important Role of Phosphatidylserine, ADAM17, TNF-Alpha, and Soluble MER on Efferocytosis Activity in Central Obesity.
Purnama CA, Meiliana A, Barliana MI, Lestari K, Wijaya A. Purnama CA, et al. J Obes. 2024 Mar 20;2024:1424404. doi: 10.1155/2024/1424404. eCollection 2024. J Obes. 2024. PMID: 38550672 Free PMC article. - Multiple beneficial effects of 1-year nutritional-behavioral intervention on anthropometric and metabolic parameters in overweight and obese boys.
Tosi M, Matelloni IA, Mancini M, Andreassi A, Scopari A, Rossi A, Verduci E, Berra C, Manfrini R, Banderali G, Pecori Giraldi F, Folli F. Tosi M, et al. J Endocrinol Invest. 2023 Nov;46(11):2331-2342. doi: 10.1007/s40618-023-02088-2. Epub 2023 Apr 18. J Endocrinol Invest. 2023. PMID: 37069323
References
- DeFronzo RA. Pathogenesis of type 2 diabetes mellitus. Med Clin North Am. 2004;88:787–835. - PubMed
- Van Gaal LF, Mertens IL, de Block CE. Mechanisms linking obesity with cardiovascular disease. Nature. 2006;444:875–880. - PubMed
- Hotamisligil GS, Shargill NS, Spiegelman BM. Adipose expression of tumor necrosis factor-alpha: direct role in obesity-linked insulin resistance. Science. 1993;259:87–91. - PubMed
Publication types
MeSH terms
Substances
Grants and funding
- R01 DK024092/DK/NIDDK NIH HHS/United States
- P01 AG019316/AG/NIA NIH HHS/United States
- P30 AG013319/AG/NIA NIH HHS/United States
- F32 HL086089-03/HL/NHLBI NIH HHS/United States
- R01 DK067690/DK/NIDDK NIH HHS/United States
- R01 DK080157/DK/NIDDK NIH HHS/United States
- P01 AG019316-01/AG/NIA NIH HHS/United States
- P30 CA054174/CA/NCI NIH HHS/United States
- P30 AG013319-05/AG/NIA NIH HHS/United States
- L60 MD000986/MD/NIMHD NIH HHS/United States
- R37 AG007218/AG/NIA NIH HHS/United States
- R01 DK067690-05/DK/NIDDK NIH HHS/United States
- F32 HL086089/HL/NHLBI NIH HHS/United States
- R01 DK024092-27/DK/NIDDK NIH HHS/United States
- K23 AG030979/AG/NIA NIH HHS/United States
- L60 MD000986-04/MD/NIMHD NIH HHS/United States
- R01 DK079195/DK/NIDDK NIH HHS/United States
- K23 AG030979-03/AG/NIA NIH HHS/United States
- P30 CA054174-09/CA/NCI NIH HHS/United States
- R01 DK080157-03/DK/NIDDK NIH HHS/United States
LinkOut - more resources
Full Text Sources
Medical
Research Materials
Miscellaneous


