Dynamic interaction of amphiphysin with N-WASP regulates actin assembly - PubMed (original) (raw)
. 2009 Dec 4;284(49):34244-56.
doi: 10.1074/jbc.M109.064204. Epub 2009 Sep 16.
Sergi Padilla-Parra, Sun-Joo Park, Toshiki Itoh, Mathilde Chaineau, Ilaria Monaldi, Ottavio Cremona, Fabio Benfenati, Pietro De Camilli, Maïté Coppey-Moisan, Marc Tramier, Thierry Galli, Kohji Takei
Affiliations
- PMID: 19759398
- PMCID: PMC2797194
- DOI: 10.1074/jbc.M109.064204
Dynamic interaction of amphiphysin with N-WASP regulates actin assembly
Hiroshi Yamada et al. J Biol Chem. 2009.
Abstract
Amphiphysin 1, an endocytic adaptor concentrated at synapses that couples clathrin-mediated endocytosis to dynamin-dependent fission, was also shown to have a regulatory role in actin dynamics. Here, we report that amphiphysin 1 interacts with N-WASP and stimulates N-WASP- and Arp2/3-dependent actin polymerization. Both the Src homology 3 and the N-BAR domains are required for this stimulation. Acidic liposome-triggered, N-WASP-dependent actin polymerization is strongly impaired in brain cytosol of amphiphysin 1 knock-out mice. FRET-FLIM analysis of Sertoli cells, where endogenously expressed amphiphysin 1 co-localizes with N-WASP in peripheral ruffles, confirmed the association between the two proteins in vivo. This association undergoes regulation and is enhanced by stimulating phosphatidylserine receptors on the cell surface with phosphatidylserine-containing liposomes that trigger ruffle formation. These results indicate that actin regulation is a key function of amphiphysin 1 and that such function cooperates with the endocytic adaptor role and membrane shaping/curvature sensing properties of the protein during the endocytic reaction.
Figures
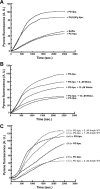
FIGURE 1.
Actin dynamics is reduced in amphiphysin 1−/− in synapse and brain cytosol. A, liposome-induced actin polymerization measured by pyrene fluorescence. Wild type brain cytosols were treated with 100 μ
m
liposomes composed of 50% PS and 50% PC (+PS-lipo.) or 90% PC and 10% PI(4,5)P2 (+PI(4,5)P_2_-lipo.). As controls, the incubation was carried out in the presence of 100 μ
m
100% PC (+PC-lipo.) or in the absence of liposomes (+Buffer). Time 0 indicates the time when the liposomes were added. B, inhibition of PS-induced actin polymerization by wiskostatin. Brain cytosol was pretreated with 5 or 10 μ
m
wiskostatin (Wisko.) for 10 min. Then, the cytosol was stimulated with PS-liposomes or PC-liposomes. C, reduction of actin polymerization in amphiphysin 1−/− brain cytosol ((−/−) + PS-lipo.). The reduction was recovered in the presence of PS by adding back 1 or 2 μ
m
of recombinant full-length amphiphysin to the amphiphysin 1−/− cytosol. The incubation was carried out as in B. D, actin, but not dynamin 1 and synaptophysin, was decreased in amphiphysin 1−/− synaptosomes. Quantitative comparison of actin levels in total brain cytosol (left panel, n = 8 for both genotypes) and synaptosomes (right panel, n = 4 for both genotypes) from WT or amphiphysin 1−/− mice. Twenty μg of each fraction per lane were analyzed. Representative Western blots using antibody directed against actin, synaptophysin, or dynamin 1 were shown (upper panel). The amount of actin was measured by densitometry. Statistical significance was determined by Student's t tests (**, p < 0.01). E, cycling of actin assembly in depolarized synaptosomes. Synaptosomes from of WT (closed circles) and amphiphysin 1−/− mice (open circles) were depolarized with high K+ for the indicated times. Amounts of F-actin (left panel) and G-actin (right panel) were fluorometrically measured by rhodamine-phalloidin and Oregon Green-DNase I, respectively. Each data point represents the mean ± S.E. of the fluorometric readings performed from 10 independent experiments.
FIGURE 2.
Amphiphysin 1 directly interacts with N-WASP. SH3-mediated binding of amphiphysin 1 (Amph) with N-WASP in synaptosomes (A) and Sertoli cells (B). A, Western blot analysis of a representative pulldown experiment from RIPA extracts of rat brain synaptosomes (2 mg of protein/sample) with GST or GST fused to the SH3 domains of amphiphysin 1 (5 nmol of fusion protein/sample preadsorbed to 60 μl of GSH-Sepharose). Wave was used as a negative control. Proteins that bound to GSH beads were probed with antibodies recognizing both endogenous N-WASP and WAVE. The 1st lane (Input) shows the total amount of N-WASP and WAVE in the starting material. The experiments were performed five times with similar results. B, 300 μg of GST-Amph (WT), GST-Amph (Δ_SH3_), GST-Amph (SH3), GST-Amph (Δ_N-BAR_), or GST bound to GSH beads were incubated with 0.7 mg of Ser-W3 cell lysates transfected with myc-N-WASP proteins solubilized by 1% Triton X-100 for 2 h. N-WASP bound to the beads was analyzed by Western blotting with antibodies against Myc. The same samples were analyzed using anti-dynamin 2 antibodies. C, pulldown experiments using purified proteins. His6-N-WASP at 100 μg was incubated with 50 μl of Ni-NTA beads for 1 h at 4 °C. After gentle washing, 20 μl of His6-N-WASP-bound Ni-NTA beads or Ni-NTA beads alone were incubated with 50 μg of amphiphysin WT in PBS (pH 8.0) containing 0.01% Tween 20 at 4 °C for 2 h. N-WASP and amphiphysin WT (Amph WT) bound to the beads were separated by SDS-PAGE and stained with Coomassie Brilliant Blue. Five hundred ng of His6-N-WASP or amphiphysin WT were loaded as standards.
FIGURE 3.
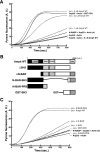
Amphiphysin 1 stimulates N-WASP-dependent actin assembly. A, actin polymerization with 60 n
m
Arp2/3 complex and 100 n
m
N-WASP in XB buffer was examined in the presence of various concentrations of recombinant amphiphysin 1 (+Amph WT). One hundred n
m
GST-VCA was used as positive control as described previously (20, 44). B, domain structures of the amphiphysin 1 constructs used in C. N-BAR, N-terminal amphipathic helix preceding the consensus BAR (BIN/amphiphysin/Rvs) domain; PRS, proline-rich stretch; CLAP, clathrin-AP2-binding domain; SH3, Src homology 3. C, both N-BAR and SH3 domain are required for stimulating N-WASP-dependent actin assembly. Actin polymerization with Arp2/3 complex and N-WASP proteins was examined as described in A using 5 μ
m
of mutant proteins.
FIGURE 4.
Amphiphysin 1 and N-WASP accumulate at ruffles. Ser-W3 cells were transfected with myc-N-WASP. After 24 h of transfection, ruffle formation was induced by stimulating PS receptors on the cell surface with 0.25 m
m
PS-liposomes at 37 °C for 10 min. Cells were fixed, permeabilized, and stained with anti-Myc antibodies and/or anti-amphiphysin 1 (Amph 1) antibodies (monoclonal antibody 3). Actin filaments were visualized by Alexa 568-phalloidin. Arrowheads in the upper panel indicate ruffles. Areas enclosed with rectangles in the middle panel were shown at higher magnification in the lower panel. Note that the co-localization of amphiphysin 1 and N-WASP is restricted to ruffles (arrowheads). Bar, 20 μm.
FIGURE 5.
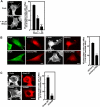
Amphiphysin 1-N-WASP complex is involved in PS-dependent ruffle formation. A, dysfunction of N-WASP causes decrease of PS-dependent ruffle formation in Ser-W3 cells. Ser-W3 cells were preincubated with or without wiskostatin (Wisko.) at the indicated concentrations at 37 °C for 30 min, and then cells were stimulated, and the ruffle formation was analyzed. All results represent the mean ± S.E. from the three experiments. Statistical significance was determined by Student's t tests (**, p < 0.01; *, p < 0.05). Bar, 20 μm. B, expression of mCherry-tagged proline-rich domain of N-WASP inhibited PS-dependent recruitment of amphiphysin 1 (Amph) to cell periphery in Ser-W3 cells (B, left two columns) and ruffle formation (B, right two columns). Cells were stimulated with PS-liposomes at 37 °C for 10 min. Then, endogenous amphiphysin 1 or F-actin was stained with anti-amphiphysin 1 antibodies (monoclonal antibody 3) or Alexa 488-phalloidin. Bar, 10 μm. C, effect of Myc-taggedΔN-BAR of amphiphysin 1 on PS-dependent ruffle formation was shown. Quantitative analysis for the results in B and C represents the mean ± S.E. from the three experiments. Statistical significance was determined by Student's t tests (**, p < 0.01). Bar, 10 μm. All the samples were examined by fluorescent confocal microscopy, and representative micrographs are shown. Arrowheads indicate ruffles.
FIGURE 6.
Dimerization of amphiphysin 1 in Ser-W3 cell by FRET-FLIM. A, dimerization of amphiphysin 1 in Ser-W3 cells. FLIM and minimal fraction of donor engaged in FRET (_mf_D) images of GFP-amphiphysin expressed alone as control (upper panel) or with amphiphysin 1-mCherry (lower panel) were obtained using TriMscope as described under “Experimental Procedures.” Three-dimensional representation of _mf_D images was obtained using a threshold limit given by the control (0.2). GFP-lifetime decreased in the presence of amphiphysin 1-mCherry. Bar, 10 μm. B, lifetime (left panel) and _mf_D histograms (right panel) of the control (green) and the co-transfection (red) cells show a decrease of the GFP lifetime from 2.48 ns (control) to 2.41 ns (co-expression) and the mean value of _mf_D from 0 (control) to 0.11 (co-expression).
FIGURE 7.
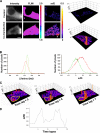
Spatio-temporal association of amphiphysin 1 with N-WASP. A, amphiphysin 1/N-WASP interaction. FLIM and _mf_D images of GFP-amphiphysin 1 expressed alone as control (upper panel) or with mCherry-N-WASP (lower panel) present a localized decrease at the periphery of the cell (shown by arrowhead). Three-dimensional _mf_D image (threshold limit of 0.1 given by the control) highlights the localization and its extent (up to 0.30 for this example). Bar, 10 μm. B, lifetime (left panel) and _mf_D histograms (right panel) of control (green) and co-transfected (red) cells show a lifetime and _mf_D variation from 2.48 ns (control) to 2.43 ns (co-expression) and from 0 (control) to 0.09 (co-expression), respectively. C, time-lapse of amphiphysin 1/N-WASP interaction. GFP-amphiphysin 1 expressed with mCherry-N-WASP in Ser-W3 cell was imaged and captured every 12 s during 240 s using the TriM-FLIM system. Time-lapse of the 20 _mf_D images is presented in
supplemental Movie S1
. Here, three-dimensional images of _mf_D values at time 60, 72, and 84 s are shown (threshold limit of 0.1 given by the control), exhibiting the increase of transient localized amphiphysin 1/N-WASP interaction at the periphery of the cell. D, time profile of the region of interest shown in C during all the time-lapse experiments presents two consecutive peaks for amphiphysin 1/N-WASP transient interaction (time lag 7 (84 s) and time lag 15 (180 s)) at the same region of the cell.
FIGURE 8.
Possible role of amphiphysin 1-N-WASP complex in actin assembly. N-WASP is activated upon binding to the amphiphysin dimer, and the complex induces Arp2/3-dependent actin assembly. This interaction occurs in proximity to the plasma membrane where polymerized actin network may assist dynamin-dependent endocytosis or support ruffle formation. For simplification, coat components and other actin related proteins are omitted.
Similar articles
- Amphiphysin 1 is important for actin polymerization during phagocytosis.
Yamada H, Ohashi E, Abe T, Kusumi N, Li SA, Yoshida Y, Watanabe M, Tomizawa K, Kashiwakura Y, Kumon H, Matsui H, Takei K. Yamada H, et al. Mol Biol Cell. 2007 Nov;18(11):4669-80. doi: 10.1091/mbc.e07-04-0296. Epub 2007 Sep 12. Mol Biol Cell. 2007. PMID: 17855509 Free PMC article. - SNX9 couples actin assembly to phosphoinositide signals and is required for membrane remodeling during endocytosis.
Yarar D, Waterman-Storer CM, Schmid SL. Yarar D, et al. Dev Cell. 2007 Jul;13(1):43-56. doi: 10.1016/j.devcel.2007.04.014. Dev Cell. 2007. PMID: 17609109 - EFC/F-BAR proteins and the N-WASP-WIP complex induce membrane curvature-dependent actin polymerization.
Takano K, Toyooka K, Suetsugu S. Takano K, et al. EMBO J. 2008 Nov 5;27(21):2817-28. doi: 10.1038/emboj.2008.216. Epub 2008 Oct 16. EMBO J. 2008. PMID: 18923421 Free PMC article. - Amphiphysin I and regulation of synaptic vesicle endocytosis.
Wu Y, Matsui H, Tomizawa K. Wu Y, et al. Acta Med Okayama. 2009 Dec;63(6):305-23. doi: 10.18926/AMO/31822. Acta Med Okayama. 2009. PMID: 20035287 Review. - Biochemical and functional significance of F-BAR domain proteins interaction with WASP/N-WASP.
Chen Y, Aardema J, Corey SJ. Chen Y, et al. Semin Cell Dev Biol. 2013 Apr;24(4):280-6. doi: 10.1016/j.semcdb.2013.01.005. Epub 2013 Feb 4. Semin Cell Dev Biol. 2013. PMID: 23384583 Review.
Cited by
- BIN1 regulates actin-membrane interactions during IRSp53-dependent filopodia formation.
Picas L, André-Arpin C, Comunale F, Bousquet H, Tsai FC, Rico F, Maiuri P, Pernier J, Bodin S, Nicot AS, Laporte J, Bassereau P, Goud B, Gauthier-Rouvière C, Miserey S. Picas L, et al. Commun Biol. 2024 May 9;7(1):549. doi: 10.1038/s42003-024-06168-8. Commun Biol. 2024. PMID: 38724689 Free PMC article. - WASP family proteins: Molecular mechanisms and implications in human disease.
Kramer DA, Piper HK, Chen B. Kramer DA, et al. Eur J Cell Biol. 2022 Jun-Aug;101(3):151244. doi: 10.1016/j.ejcb.2022.151244. Epub 2022 Jun 1. Eur J Cell Biol. 2022. PMID: 35667337 Free PMC article. - BAR proteins in cancer and blood disorders.
Chen Y, Aardema J, Misra A, Corey SJ. Chen Y, et al. Int J Biochem Mol Biol. 2012;3(2):198-208. Epub 2012 May 18. Int J Biochem Mol Biol. 2012. PMID: 22773959 Free PMC article. - BAR domain proteins-a linkage between cellular membranes, signaling pathways, and the actin cytoskeleton.
Carman PJ, Dominguez R. Carman PJ, et al. Biophys Rev. 2018 Dec;10(6):1587-1604. doi: 10.1007/s12551-018-0467-7. Epub 2018 Nov 19. Biophys Rev. 2018. PMID: 30456600 Free PMC article. Review. - α1A-adrenergic receptor induces activation of extracellular signal-regulated kinase 1/2 through endocytic pathway.
Liu F, He K, Yang X, Xu N, Liang Z, Xu M, Zhao X, Han Q, Zhang Y. Liu F, et al. PLoS One. 2011;6(6):e21520. doi: 10.1371/journal.pone.0021520. Epub 2011 Jun 28. PLoS One. 2011. PMID: 21738688 Free PMC article.
References
- Pollard T. D., Borisy G. G. (2003) Cell 112, 453–465 - PubMed
- Takenawa T., Suetsugu S. (2007) Nat. Rev. Mol. Cell Biol. 8, 37–48 - PubMed
- Watanabe M., Tsutsui K., Hosoya O., Tsutsui K., Kumon H., Tokunaga A. (2001) Biochem. Biophys. Res. Commun. 287, 739–745 - PubMed
Publication types
MeSH terms
Substances
LinkOut - more resources
Full Text Sources
Molecular Biology Databases
Miscellaneous


