Dysregulation of ribosome biogenesis and translational capacity is associated with tumor progression of human breast cancer cells - PubMed (original) (raw)
Dysregulation of ribosome biogenesis and translational capacity is associated with tumor progression of human breast cancer cells
Stéphane Belin et al. PLoS One. 2009.
Abstract
Protein synthesis is a fundamental cell process and ribosomes - particularly through the ribosomal RNA that display ribozyme activity--are the main effectors of this process. Ribosome biogenesis is a very complex process involving transcriptional aswell as many post-transcriptional steps to produce functional ribosomes. It is now well demonstrated that ribosome production is enhanced in cancer cells and that ribosome biogenesis plays a crucial role in tumor progression. However, at present there is an important lack of data to determine whether the entire process of ribosome biogenesis and ribosome assembly is modified during tumor progression and what could be the potential impact on the dysregulation of translational control that is observed in cancer cells. In breast cancer cells displaying enhanced aggressivity, both in vitro and in vivo, we have analyzed the major steps of ribosome biogenesis and the translational capacity of the resulting ribosome. We show that increased tumorigenicity was associated with modifications of nucleolar morphology and profound quantitative and qualitative alterations in ribosomal biogenesis and function. Specifically cells with enhanced tumor aggressivity displayed increased synthesis of 45S pre-rRNA, with activation of an alternative preRNA synthetic pathway containing a 43S precursor and enhanced post-transcriptional methylation of specifc sites located in the 28S rRNA. While the global translational activity was not modified, IRES-initiated translation, notably that of p53 mRNA, was less efficient and the control of translational fidelity was importantly reduced in cells with increased aggressivity. These results suggest that acquisition of enhanced tumor aggressivity can be associated with profound qualitative alterations in ribosomal control, leading to reduced quality control of translation in cancer cells.
Conflict of interest statement
Competing Interests: The authors have declared that no competing interests exist.
Figures
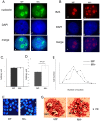
Figure 1. The nucleolar structure is profoundly altered in aggressive human breast cancer cells.
Immunofluorescent detection of the nucleoli of the two cell lines using the nucleolin antibody (A) and the B23 antibody (B) on panels a and b. The nuclei are identified using DAPI staining (blue signal) on panels c and d and images of merged signals are presented on panels e and f. (C) Analysis of the circularity of the nucleoli was performed as described in material and methods using Image J software, and no significant differences were observed between the two cell lines. The same image analysis was conducted for the calculation of the nucleolar area (D), demonstrating that nucleoli of MA- cells exhibit nucleoli 30% larger than those of MP cells (p = 0.01). The number of nucleoli per nucleus was quantified in MP and MA- cell (E). The graphic shows that MP cells have an average of 4 nucleoli per cell whereas the average for MA- cells is about 6 nucleoli per cell (p = 0.01). (F) Confocal microscopic analysis after DAPI staining showed that 40% of MA- cells vs. MP cells present very dense nucleoli (p≤0.01). Electron microscopic analysis of MA- and MP nucleoli is presented in (G). The nucleoli of MA- cells exhibit significantly more fibrillar center as compared to those of MP cells (p≤0.01). GC: granular component, DFC: dense fibrillar component, FC: fibrillar center represented by a star. Scale bar is 1,2 µm.
Figure 2. Polymerase I activity and ribosome biogenesis are activated in aggressive human breast cancer cells.
A: RNA polymerase I activity. The activity of the RNA pol I was investigated in MP and MA- cells by counting the radioactivity directly incorporated into the 45S pre-rRNA . Quantification of the amount of [3H]-uridine incorporated into pre-rRNA 45S show a 20% increase in MA- cells (p = 0.05, n = 3). The amount of radioactivity is expressed as percentage with the result obtained for MP cells taken as the reference and is presented as mean +− S. E. M (n = 3). B: Rate of cytoplasmic ribosome biogenesis. The rate of ribosome biogenesis was evaluated by counting the radioactivity incorporated into purified mature cytoplasmic ribosome. Quantification of the amount of [3H]-uridine incorporated into cytoplasmic ribosome (determined as above) demonstrate a 20% increase in cytoplasmic ribosome biogenesis in MA- cells as compared to control MP cell (n = 3).
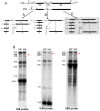
Figure 3. A new rRNA processing pathway is detected in aggressive human breast cancer cells.
A: rRNA processing pathways. Simplified diagram of the two major pre-RNA processing pathway in HeLa cells (pathways A and B) and a third chemically-induced pathway (pathway C). Thin lines represent the sequences that are eliminated during the processing (5′ETS, ITS1, ITS2, 3′ETS) to provide mature rRNA (18S, 5.8S and 28S) represented by thick black boxes. Names of the intermediary species refer to the current nomenclature. The positions of the main cleavage sites are indicated by arrowheads and refer to conventional numbering. B: Northern blot analyses. Nuclear RNA (3 µg) was analysed by northern blot using specific probes for the 18S, 5.8S and 28S sequences. Results show that all the pre-rRNA corresponding to the pathways A and B of rRNA maturation exist in MP and MA- cells. A third pathway of rRNA maturation characterized by the presence of the 43S pre-rRNA (red arrow) is evidenced only in the aggressive MA- cell line. This intermediary is specific of the C pathway.
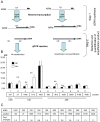
Figure 4. The specificity of the methylation pattern of rRNA is altered in aggressive human breast cancer cells.
A: schematic representation of the RT-PCR mapping method used to analyse the methylation pattern of rRNA. The first RT step is identical to the conventional method of rRNA methylations analysis. In the second step however, some adaptations were introduced, first by using a non-radiolabelled probe and next by performing a qPCR of the two RT products. B: Methylation ratio of eleven sites distributed throughout the three rRNA. The position line indicates the number of the nucleotide that is analysed. White bars indicate the methylation ratio (MR) of MP cells and black bars indicate the MR of MA- cells. One site was analysed for the 5.8S, four sites for the 18S and six sites for the 28S according to the method described in the experimental procedure. The MR for the sites analysed on the 5.8S are equivalent in the two cell lines whereas the MR of the sites on the 28S and 18S are higher in MA- cells as compared to control MP cells. Significant differences are indicated by the stars. C: Fold change in the MR between MA- and control MP cells. The fold change represents the calculation of the ratio between the MR of MA- cells and the MR of MP cells. As indicated in this table, the fold changes in the MR between MA- and MP cells are usually between 1.5 and 2 for the selected sites on the 28S rRNA whereas the fold changes are about 1 for selected sites on the 5.8S and 18S rRNA. Only one site (1713) on the 18S rRNA exhibit a fold change in the MR between MA- and MP cells of 6.
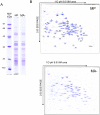
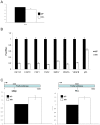
Figure 5. The protein composition of the ribosome is not modified in aggressive human breast cancer cells.
The composition of the ribosome from MA- and MP cells was analysed on purified fractions of cytoplasmic ribosome obtained as described in material and methods. Ribosomal proteins were first resolved by 1D SDS-PAGE (panel A), and every ribosomal protein could be clearly detected in the two cell lines, with no apparent quantitative alteration. To increase the resolution of the analysis, ribosomal proteins were next resolved by using a specific 2D-gel system (B) and each protein spot was quantified by image analysis using the ImageMaster© software. Again, no difference was observed in the composition of ribosomal proteins between the MA- and MP cell lines.
Figure 6. The translational capacity of the ribosome is modified in aggressive human breast cancer cells.
A: Rate of global protein synthesis. Cells were incubated in a mixture of 35S labelled-cystein and methionine. Total proteins (15 µg) were separated by monodimensional electrophpresis and transferred to a nitrocellulose membrane. The radioactivity incorporated into proteins was measured using a PhosphorImager (Typhoon Trio, GE©). The results represent three independent experiments and the radioactive counting was done in triplicate. In each experimental condition the data obtained (Mean +/− S.D) are expressed as the percentage of those obtained in the control MP cell line. The results show no significant differences in the global rate of protein synthesis between the MA- and the MP cell lines. B: Determination of the translation initiation through IRES. Both Firefly and Renilla Luciferase were transfected into the cells and activities were measured as described under “materials and methods.” The result for the Firefly luciferase was normalized by the data for Renilla luciferase activity. In each condition of transfection, the data obtained (Mean +/− S.D, n = 5) are expressed as the percentage of those obtained in the control MP cell line. The results clearly indicate that translation initiation through IRES is impaired in MA- cells as compared to MP cells. C: Analysis of translational fidelity in MA- and MP cells. Both cell lines were transfected either with the pGL3m1 vector (stop mutant) or the pGL3 wild type vector. Luciferase activities of the mutant vector and of the pGL3 vector were assessed by co-transfecting the pRL vector. The results of the Firefly luciferase activity of the mutant were normalized by the Firefly luciferase activity of the wild type vector. The data (Mean +/− S.D, n = 5) are expressed as the percentage of those obtained in the control MP cell line. The results indicate that firefly luciferase activity of the mutant vector is highly expressed in MA- cells as compared to MP cells. D: Analysis of translational fidelity in MA- and MP cells using another mutant vector (pGL3m2). Cells were transfected with either the pGL3m2 vector or the pGL3 wild type vector. Luciferase activities of the mutant vector and of the pGL3 vector were assessed by co-transfecting the pRL vector The results of the Firefly luciferase activity of the mutant were normalized by the Firefly luciferase activity of the wild type vector. The data (Mean +/− S.D, n = 5) are expressed as the percentage of those obtained in the control MP cell line. Once again, the results indicate that firefly luciferase activity of the mutant vector is highly expressed in MA- cells as compared to MP cells, clearly demonstrating a strong defect in translational fidelity of MA- cells.
Similar articles
- The RNA recognition motif of NIFK is required for rRNA maturation during cell cycle progression.
Pan WA, Tsai HY, Wang SC, Hsiao M, Wu PY, Tsai MD. Pan WA, et al. RNA Biol. 2015;12(3):255-67. doi: 10.1080/15476286.2015.1017221. RNA Biol. 2015. PMID: 25826659 Free PMC article. - p53 acts as a safeguard of translational control by regulating fibrillarin and rRNA methylation in cancer.
Marcel V, Ghayad SE, Belin S, Therizols G, Morel AP, Solano-Gonzàlez E, Vendrell JA, Hacot S, Mertani HC, Albaret MA, Bourdon JC, Jordan L, Thompson A, Tafer Y, Cong R, Bouvet P, Saurin JC, Catez F, Prats AC, Puisieux A, Diaz JJ. Marcel V, et al. Cancer Cell. 2013 Sep 9;24(3):318-30. doi: 10.1016/j.ccr.2013.08.013. Cancer Cell. 2013. PMID: 24029231 Free PMC article. - Hypermethylation of 28S ribosomal RNA in β-thalassemia trait carriers.
Sornjai W, Lithanatudom P, Erales J, Joly P, Francina A, Hacot S, Fucharoen S, Svasti S, Diaz JJ, Mertani HC, Smith DR. Sornjai W, et al. Int J Biol Macromol. 2017 Jan;94(Pt A):728-734. doi: 10.1016/j.ijbiomac.2016.10.039. Epub 2016 Oct 17. Int J Biol Macromol. 2017. PMID: 27765567 - [About the ribosomal biogenesis in human].
Tafforeau L. Tafforeau L. Med Sci (Paris). 2015 Jun-Jul;31(6-7):622-8. doi: 10.1051/medsci/20153106015. Epub 2015 Jul 7. Med Sci (Paris). 2015. PMID: 26152166 Review. French. - Ribosome Biogenesis Alterations in Colorectal Cancer.
Nait Slimane S, Marcel V, Fenouil T, Catez F, Saurin JC, Bouvet P, Diaz JJ, Mertani HC. Nait Slimane S, et al. Cells. 2020 Oct 27;9(11):2361. doi: 10.3390/cells9112361. Cells. 2020. PMID: 33120992 Free PMC article. Review.
Cited by
- Quantitative profiling of pseudouridylation dynamics in native RNAs with nanopore sequencing.
Begik O, Lucas MC, Pryszcz LP, Ramirez JM, Medina R, Milenkovic I, Cruciani S, Liu H, Vieira HGS, Sas-Chen A, Mattick JS, Schwartz S, Novoa EM. Begik O, et al. Nat Biotechnol. 2021 Oct;39(10):1278-1291. doi: 10.1038/s41587-021-00915-6. Epub 2021 May 13. Nat Biotechnol. 2021. PMID: 33986546 - Uncovering Oncogenic Mechanisms of Tumor Suppressor Genes in Breast Cancer Multi-Omics Data.
Cho SB. Cho SB. Int J Mol Sci. 2022 Aug 25;23(17):9624. doi: 10.3390/ijms23179624. Int J Mol Sci. 2022. PMID: 36077026 Free PMC article. - Using functional signatures to identify repositioned drugs for breast, myelogenous leukemia and prostate cancer.
Shigemizu D, Hu Z, Hung JH, Huang CL, Wang Y, DeLisi C. Shigemizu D, et al. PLoS Comput Biol. 2012 Feb;8(2):e1002347. doi: 10.1371/journal.pcbi.1002347. Epub 2012 Feb 9. PLoS Comput Biol. 2012. PMID: 22346740 Free PMC article. - Block of Proliferation 1 Promotes Proliferation, Invasion and Epithelial Mesenchymal Transformation in Gastric Cancer.
He J, Chen Z, Xue Q, Shi W. He J, et al. Oxid Med Cell Longev. 2022 Feb 16;2022:2946989. doi: 10.1155/2022/2946989. eCollection 2022. Oxid Med Cell Longev. 2022. PMID: 35222794 Free PMC article. - RNA 2'-O-Methylation (Nm) Modification in Human Diseases.
Dimitrova DG, Teysset L, Carré C. Dimitrova DG, et al. Genes (Basel). 2019 Feb 5;10(2):117. doi: 10.3390/genes10020117. Genes (Basel). 2019. PMID: 30764532 Free PMC article. Review.
References
- Boisvert FM, van Koningsbruggen S, Navascues J, Lamond AI. The multifunctional nucleolus. Nat Rev Mol Cell Biol 2007 - PubMed
- Coute Y, Burgess JA, Diaz JJ, Chichester C, Lisacek F, et al. Deciphering the human nucleolar proteome. Mass Spectrom Rev. 2006;25:215–234. - PubMed
- Derenzini M. The AgNORs. Micron. 2000;31:117–120. - PubMed
- Pich A, Chiusa L, Margaria E. Prognostic relevance of AgNORs in tumor pathology. Micron. 2000;31:133–141. - PubMed
Publication types
MeSH terms
Substances
LinkOut - more resources
Full Text Sources
Other Literature Sources
Medical
Research Materials
Miscellaneous
