A new paradigm for MAPK: structural interactions of hERK1 with mitochondria in HeLa cells - PubMed (original) (raw)
A new paradigm for MAPK: structural interactions of hERK1 with mitochondria in HeLa cells
Soledad Galli et al. PLoS One. 2009.
Abstract
Extracellular signal-regulated protein kinase 1 and 2 (ERK1/2) are members of the MAPK family and participate in the transduction of stimuli in cellular responses. Their long-term actions are accomplished by promoting the expression of specific genes whereas faster responses are achieved by direct phosphorylation of downstream effectors located throughout the cell. In this study we determined that hERK1 translocates to the mitochondria of HeLa cells upon a proliferative stimulus. In the mitochondrial environment, hERK1 physically associates with (i) at least 5 mitochondrial proteins with functions related to transport (i.e. VDAC1), signalling, and metabolism; (ii) histones H2A and H4; and (iii) other cytosolic proteins. This work indicates for the first time the presence of diverse ERK-complexes in mitochondria and thus provides a new perspective for assessing the functions of ERK1 in the regulation of cellular signalling and trafficking in HeLa cells.
Conflict of interest statement
Competing Interests: The authors have declared that no competing interests exist.
Figures
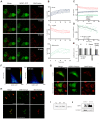
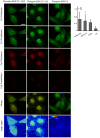
Figure 1. Presence and translocation of hERK1 into mitochondria.
(A) HeLa cells transfected with hERK1-GFP, 24 h FCS starved and stained with MitoTracker CMXRos were stimulated with 10% FCS and fluorescence intensity of both green (GFP) and red (MitoTracker) channels was followed for 20 min in an Olympus FV1000 confocal microscope. Images of four representative time points after FCS stimulation of the individual and merged channels are shown. Bar = 10 µm. (B) Changes in hERK1-GFP fluorescence intensity after FCS stimulation analyzed in mitochondria, nuclei and cytosol for each of the 8 confocal planes analysed for the pair of images in A. Graphs show the net change displayed as percentage of the initial value (% of control) in each compartment after FCS stimulation. (C) Redistribution of hERK1-GFP fluorescence intensity in the different cellular compartments upon FCS stimulation. (D) Change in Pearson's correlation coefficient after FCS stimulation of serum starved cells analyzed within the mitochondrial mask. (E) Colocalization coefficients for HeLa cells FCS starved or cultured in 10% FCS. The. M and C coefficients were calculated only for red images. Manders Overlap = Manders Overlap coefficient. (F) hERK1-GFP and MitoTracker intensity correlation plots 0 and 20 min after FCS stimulation. Color bar = number of pixels. (G) HeLa cells transfected with hERK1-Dronpa, stained with MitoTracker Deep Red and washed in 0.1% Triton X-100 buffer (lower panel). An image of the individual and merged channels is shown compared to non-Triton washed cells (upper panel). (H) Isolated mitochondria from serum starved HeLa cells (lower panel) or cells cultured in 10% FCS (upper panel). Cells were labelled with MitoTracker Deep Red and further fixed and immuno-stained for phospho-ERK. Secondary antibody was conjugated to Cy3. An image of the individual and merged channels is shown for each case. (I) Western blot of different HeLa cellular fractions probed against ERK1/2. C = cytosol, M = mitochondria, N = nuclei. (J) Mitochondria from HeLa incubated with hERK1 recombinant protein in an import assay, and analyzed by western blotting. Loading control, antibody to a mitochondrial complex 1 subunit.
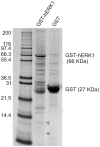
Figure 2. hERK1-GST pulldown assay. GST-hERK1 or GST-null recombinant proteins immobilized on GSH-agarose were incubated overnight with a mitochondrial extract.
Beads were extensively washed and eluted proteins were run on SDS-PAGE. Proteins were stained with Coomasie Brilliant Blue G-250. Molecular weight markers displayed on the left. GST-hERK1 and GST-null recombinant proteins highlighted on the right. Numbers on the right side of the bands recovered in GST-hERK lane represent proteins identified by mass spectrometry and shown in Table 1.
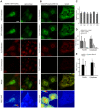
Figure 3. ERK interaction with VDAC.
(A) HeLa cells transfected with hERK1-GFP, fixed and labelled against VDAC. Secondary antibody was conjugated with Cy3. The GFP and Cy3 images prior and after Cy3 photobleaching, the merged image of GFP and Cy3 prior to photobleaching and a FRET map according to Eq. 1 are shown. Bar = 10 µm. Color bar = FRET efficiency. Negative control: the same FRET experiment in HeLa cells transfected with GFP and further stained against VDAC as above. Representative images shown on the right. (B) HeLa cells fixed and stained with antibodies to phospho-ERK and VDAC. Secondary antibodies conjugated to Cy5 and Cy3, respectively. Cy3 and Cy5 images prior and after Cy5 photobleaching, a merged image of Cy3 and Cy5 prior to photobleaching and a FRET map in accord to Eq. 1 are shown. Bar = 10 µm. Color bar = FRET efficiency. Negative control: HeLa cells labelled against VDAC with both secondary antibodies; image series shown on the right. (C) Colocalization indexes estimated for HeLa cells transfected with hERK1-GFP and labelled for VDAC as in (A). M and C coefficients were estimated for both green and red channel images (Mgreen, Mred, Cgreen, Cred). P = Pearson's correlation coefficient, MO = Manders Overlap Coefficient. (D) Mean FRET efficiency in HeLa cells transfected with hERK1-GFP and labelled for VDAC as in (A) in accord to Eq. 1. Negative controls: HeLa cells transfected with GFP and labelled against VDAC plus Cy3 for specificity (light grey bars) and HeLa cells transfected with hERK1-GFP and no further staining for a FRET negative value (black bars); *p<0.5 with respect to GFP transfected cells. (E) Mean FRET efficiency in HeLa cells labelled for phospho-ERK and VDAC plus Cy5 and Cy3, respectively, in accordance with Eq. 1. Negative controls: HeLa cells labelled with antibody to VDAC plus both secondary antibodies for specificity (white bars); *p<0.5 with respect to negative control (Student's t test).
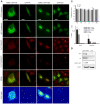
Figure 4. hERK1 interaction with histones.
(A) HeLa cells transfected with hERK1-GFP, fixed and labelled with antibodies to H2A and H4 and a secondary antibody conjugated with Cy3. GFP and Cy3 images prior and after Cy3 photobleaching, a merged image of GFP and Cy3 prior to photobleaching and a FRET map in accord to Eq. 1 are shown. Bar = 10 µm. Color bar = FRET efficiency. Negative control: same FRET experiment in HeLa cells transfected with GFP and further stained against histones as above. Representative images are shown. (B) Colocalization indexes. M and C coefficients were estimated for both green and red images (Mgreen, Mred, Cgreen, Cred). P = Pearson's correlation coefficient, MO = Manders Overlap Coefficient. (C) Mean FRET efficiency estimated and analyzed as in Fig. 3; *p<0.5 with respect to GFP transfected cells. §p<0.5 with respect to hERK1-GFP transfected cells with no histone or Cy3 staining. (D) Pulldown experiment performed as in Fig. 2, with proteins detected by western blotting.
Figure 5. Endogenous ERK1/2 interaction with histones.
HeLa cells fixed and stained against phospho-ERK and histones. Secondary antibodies conjugated to Cy3 and Cy5 respectively. Cy3 and Cy5 images prior and after Cy5 photobleaching, a merge image of Cy3 and Cy5 prior to photobleaching and a FRET map in accordance with Eq. 1 are shown. Bar = 10 µm. Color bar = FRET efficiency. Control for specificity of ERK-histones interaction: HeLa cells labelled with antibody to phospho-ERK and both secondary antibodies (PERK); representative images are shown. Negative FRET control: HeLa cells labelled for phospho-ERK and secondary Cy3 antibody (CN). Mean FRET efficiency shown in the bar graph on the upper right side; *p<0.5 respect to negative control and §p<0.5 with respect to specificity control (ANOVA and Scheffé test).
Figure 6. ERK dimer formation in mitochondria.
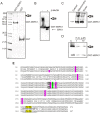
(A) Pulldown assay and electrophoresis as in Fig. 2. Samples were run in the absence of β-ME or DTT. Molecular weight markers displayed on the right. Thick arrow, GST-hERK1 dimer. (B) Recombinant hERK1-GST immobilized on GSH-agarose incubated with mitochondria with dimerization evaluated by western blotting in the presence or absence of β−ME. Thin arrow, endogenous ERK, recovered from the dimer upon incubation with β−ME. (C) hERK1-GST recombinant protein immobilized on GSH-agarose and incubated with mitochondrial, cytosolic or nuclear fractions. hERK1-GST and hERK1-GST dimer detected by western blot. (D) GST-hERK1 recombinant protein oxidized with different H2O2 concentrations and processed as in (C). Dimerization evaluated by western blotting. (E) Alignment of ERK1 (top) and ERK2 (bottom) amino acid sequences. CD domain (yellow), ED domain (grey), dimerization site (green) , , cysteines (purple) and cysteines (*) putatively involved in disulfide bond formation are highlighted.
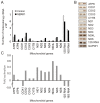
Figure 7. ERK modulatory effect on mitochondrial gene expression.
Mitochondria from HeLa cells isolated and incubated with hERK1 for 1 h at 37°C in an in organello RNA synthesis assay (see experimental procedures). mtRNA isolated and every mitochondrial gene expression evaluated by (A) Real time PCR, or (B) Semiquantitative PCR. GAPDH used as housekeeping gene. (C) Mitochondrial gene expression also studied by microarray (see experimental procedures). Mean fold-activation for every gene after ERK treatment of mitochondria (See also Table 2). ND: NADH dehydrogenase; ATP: ATP synthase; COX: cytochrome oxygenase. CYTB: cytochrome b. Number indicates subunit.
Figure 8. Postulated structural interactions of hERK1 with mitochondria.
Scheme showing a new perspective for the physiological role of hERK1 in relation to the regulation of cellular signalling and trafficking in HeLa cells. ERK1 may be a carriage protein that would facilitate histone traffic to the ATP source in the surroundings of the OMM, and afterwards to the nuclei. Altogether this complex may interact with ERK transcription factors and the transcription machinery to enhance RNA synthesis. ERK translocation into and out the mitochondria may occur via VDAC protein. Once inside, the kinase may regulate mtDNA transcription by regulation of TFAM. I, II, III and IV: mitochondrial electron transport chain complexes, Cyt: cytochrome c, ANT: ATP carrier. The model is simplified for H2A, but the same is proposed for H4.
Similar articles
- ERK-1 MAP kinase prevents TNF-induced apoptosis through bad phosphorylation and inhibition of Bax translocation in HeLa Cells.
Pucci B, Indelicato M, Paradisi V, Reali V, Pellegrini L, Aventaggiato M, Karpinich NO, Fini M, Russo MA, Farber JL, Tafani M. Pucci B, et al. J Cell Biochem. 2009 Dec 1;108(5):1166-74. doi: 10.1002/jcb.22345. J Cell Biochem. 2009. PMID: 19777442 - The activation of ERK1/2 and p38 mitogen-activated protein kinases is dynamically regulated in the developing rat visual system.
Oliveira CS, Rigon AP, Leal RB, Rossi FM. Oliveira CS, et al. Int J Dev Neurosci. 2008 May-Jun;26(3-4):355-62. doi: 10.1016/j.ijdevneu.2007.12.007. Epub 2008 Jan 6. Int J Dev Neurosci. 2008. PMID: 18280691 - Receptor sequestration in response to β-arrestin-2 phosphorylation by ERK1/2 governs steady-state levels of GPCR cell-surface expression.
Paradis JS, Ly S, Blondel-Tepaz É, Galan JA, Beautrait A, Scott MG, Enslen H, Marullo S, Roux PP, Bouvier M. Paradis JS, et al. Proc Natl Acad Sci U S A. 2015 Sep 15;112(37):E5160-8. doi: 10.1073/pnas.1508836112. Epub 2015 Aug 31. Proc Natl Acad Sci U S A. 2015. PMID: 26324936 Free PMC article. - Control of MAP kinase signaling to the nucleus.
Kondoh K, Torii S, Nishida E. Kondoh K, et al. Chromosoma. 2005 Jul;114(2):86-91. doi: 10.1007/s00412-005-0341-9. Epub 2005 May 18. Chromosoma. 2005. PMID: 15902482 Review. - Hormonal activation of a kinase cascade localized at the mitochondria is required for StAR protein activity.
Poderoso C, Maloberti P, Duarte A, Neuman I, Paz C, Cornejo Maciel F, Podesta EJ. Poderoso C, et al. Mol Cell Endocrinol. 2009 Mar 5;300(1-2):37-42. doi: 10.1016/j.mce.2008.10.009. Epub 2008 Oct 19. Mol Cell Endocrinol. 2009. PMID: 19007846 Review.
Cited by
- Control of cell death and mitochondrial fission by ERK1/2 MAP kinase signalling.
Cook SJ, Stuart K, Gilley R, Sale MJ. Cook SJ, et al. FEBS J. 2017 Dec;284(24):4177-4195. doi: 10.1111/febs.14122. Epub 2017 Jun 18. FEBS J. 2017. PMID: 28548464 Free PMC article. Review. - Mitochondria: the next (neurode)generation.
Schon EA, Przedborski S. Schon EA, et al. Neuron. 2011 Jun 23;70(6):1033-53. doi: 10.1016/j.neuron.2011.06.003. Neuron. 2011. PMID: 21689593 Free PMC article. Review. - Mitochondrial localized STAT3 is involved in NGF induced neurite outgrowth.
Zhou L, Too HP. Zhou L, et al. PLoS One. 2011;6(6):e21680. doi: 10.1371/journal.pone.0021680. Epub 2011 Jun 27. PLoS One. 2011. PMID: 21738764 Free PMC article. - Mitogen-Activated Protein (MAP) Kinase Scaffolding Proteins: A Recount.
Meister M, Tomasovic A, Banning A, Tikkanen R. Meister M, et al. Int J Mol Sci. 2013 Mar 1;14(3):4854-84. doi: 10.3390/ijms14034854. Int J Mol Sci. 2013. PMID: 23455463 Free PMC article. - Deregulation of mitochondria-shaping proteins Opa-1 and Drp-1 in manganese-induced apoptosis.
Alaimo A, Gorojod RM, Beauquis J, Muñoz MJ, Saravia F, Kotler ML. Alaimo A, et al. PLoS One. 2014 Mar 14;9(3):e91848. doi: 10.1371/journal.pone.0091848. eCollection 2014. PLoS One. 2014. PMID: 24632637 Free PMC article.
References
- Robinson MJ, Cobb MH. Mitogen-activated protein kinase pathways. Curr Opin Cell Biol. 1997;9:180–186. - PubMed
- Yoon S, Seger R. The extracellular signal-regulated kinase: Multiple substrates regulate diverse cellular functions. Growth Factors. 2006;24:21–44. - PubMed
- Poderoso C, Converso D, Maloberti P, Duarte A, Neuman I, et al. A mitocondrial kinase complex is essential to mediate an ERK1/2 phosphorylation of a key regulatory protein in steroid biosynthesis. PLoS One. 2008;3:e1443. doi: 10.1371/Journal.pone.0001443. - DOI - PMC - PubMed
Publication types
MeSH terms
Substances
LinkOut - more resources
Full Text Sources
Other Literature Sources
Molecular Biology Databases
Miscellaneous
