Sporadic ALS has compartment-specific aberrant exon splicing and altered cell-matrix adhesion biology - PubMed (original) (raw)
. 2010 Jan 15;19(2):313-28.
doi: 10.1093/hmg/ddp498. Epub 2009 Oct 28.
Affiliations
- PMID: 19864493
- PMCID: PMC2796893
- DOI: 10.1093/hmg/ddp498
Sporadic ALS has compartment-specific aberrant exon splicing and altered cell-matrix adhesion biology
Stuart J Rabin et al. Hum Mol Genet. 2010.
Abstract
Amyotrophic lateral sclerosis (ALS) is a fatal neurodegenerative disease characterized by progressive weakness from loss of motor neurons. The fundamental pathogenic mechanisms are unknown and recent evidence is implicating a significant role for abnormal exon splicing and RNA processing. Using new comprehensive genomic technologies, we studied exon splicing directly in 12 sporadic ALS and 10 control lumbar spinal cords acquired by a rapid autopsy system that processed nervous systems specifically for genomic studies. ALS patients had rostral onset and caudally advancing disease and abundant residual motor neurons in this region. We created two RNA pools, one from motor neurons collected by laser capture microdissection and one from the surrounding anterior horns. From each, we isolated RNA, amplified mRNA, profiled whole-genome exon splicing, and applied advanced bioinformatics. We employed rigorous quality control measures at all steps and validated findings by qPCR. In the motor neuron enriched mRNA pool, we found two distinct cohorts of mRNA signals, most of which were up-regulated: 148 differentially expressed genes (P <or= 10(-3)) and 411 aberrantly spliced genes (P <or= 10(-5)). The aberrantly spliced genes were highly enriched in cell adhesion (P <or= 10(-57)), especially cell-matrix as opposed to cell-cell adhesion. Most of the enriching genes encode transmembrane or secreted as opposed to nuclear or cytoplasmic proteins. The differentially expressed genes were not biologically enriched. In the anterior horn enriched mRNA pool, we could not clearly identify mRNA signals or biological enrichment. These findings, perturbed and up-regulated cell-matrix adhesion, suggest possible mechanisms for the contiguously progressive nature of motor neuron degeneration. Data deposition: GeneChip raw data (CEL-files) have been deposited for public access in the Gene Expression Omnibus (GEO), www.ncbi.nlm.nih.gov/geo, accession number GSE18920.
Figures
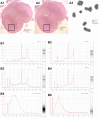
Figure 1.
Laser capture microdissection (LCM) permits collection of high quality RNA from SALS motor neurons. (A): (A1) This is a low-power transverse view of SALS lumbar spinal cord stained with H&E before LCM. The rectangle indicates the anterior horn. Note the relative abundance of residual lumbar motor neurons (purple spots) in this nervous system where disease onset was in arm and respiratory muscles. (A2) Same, after LCM—the small white blanks are where motor neurons were microdissected. Note the specificity that is achieved within the complex cytoarchitecture of the spinal cord. (A3) This is a mid-power view of motor neurons captured and adhering to a thermoplastic polymer film on an LCM cap. The cap fits into a microtube for RNA isolation. [Scale bars are 1 mm in (A1) and (A2) and 100 µm in (A3)]. (B) These are electropherograms (left side of each panel) and digital gels (right side of each panel) generated by digital micro-electrophoresis that is used to assess RNA quality. The column on the left (B1, B3 and B5) is from a SALS nervous system and the column on the right (B2, B4 and B6) is from a SOD1 G93A ALS1 transgenic mouse for comparison. The top row (B1 and B2) shows total RNA before processing by laser capture microdissection (LCM). The middle row (B3 and B4) shows total RNA of motor neurons after isolation by LCM. The bottom row (B5 and B6) shows messenger RNA from the laser captured motor neurons after amplification. The similarities in these tracings illustrate the high quality of RNAs generated from SALS patient materials.
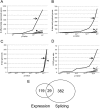
Figure 2.
Microarray analysis robustly identifies disease-associated signals in the SALS motor neuron enriched mRNA pool. (A) This graph shows the cumulative numbers of differentially expressed genes as a function of _P_-values. In this and in the other graphs, the solid line (arrow) shows the true comparison between SALS and control and the dashed lines (arrowhead) show sham comparisons of randomly permuted groups and indicate the noise levels in the data. Highly distinct differential gene expression is identified. (B) This graph shows the cumulative numbers of aberrantly spliced genes as a function of _P_-values. Note not only that significant aberrant gene splicing is identified, but also that the degree of abnormality is greater than seen with differential gene expression. (C) This graph shows cumulative numbers of Gene Ontology gene sets that enrich the differentially expressed genes identified in (A) as a function of _P_-value. There is no apparent biological enrichment of the differentially expressed genes. (D) This graph shows cumulative numbers of Gene Ontology gene sets that enrich the aberrantly spliced genes identified in (C) as a function of _P_-value. By comparison to differential gene expression, the aberrantly spliced genes are robustly enriched biologically. (E) Venn diagram comparing differentially expressed and aberrantly spliced genes in the SALS motor neuron enriched RNA pools. Note that the two cohorts of genes are distinctive and have only slight overlap.
Figure 3.
Heat map of the gene expression levels of the 57 cell adhesion genes identified by their aberrant splicing in the motor neuron enriched mRNA pool in our study. These 57 genes comprise the cell adhesion biological pathway as defined in the Gene Ontology. They were identified in our study by virtue of their marked over-representation in the 411 aberrantly spliced genes identified in the motor neuron enriched mRNA pool in SALS (P < 10−57). The colored bar indicates the range of intensity values for each gene and the heat maps display their overall gene expression levels, not their aberrant splicing. Note the relatively clean separation of SALS and control groups and the preponderant up-regulation or over-expression of these genes, which is seen in addition to their aberrant splicing. (C, control and A, SALS).
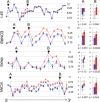
Figure 4.
Aberrant splicing predictions of the exon arrays validate by qPCR. Four examples of validation of aberrant splicing are demonstrated in this figure. The gene views on the left show the expression of exons as determined by exon array; the expression levels are shown on a log2 scale; the error bars show standard errors of means; SALS, red triangles; control, blue squares. Exons showing similar (A) and different (B) expression between SALS and control (arrows) were selected for validation by qPCR. The bar plots on the right show the results of qPCR: expression of the selected exons are normalized to GAPDH and shown on a log2 scale; the error bars show the 95% confidence intervals; SALS, red; control, blue. Asterisks indicate significant difference by _t_-test (α = 0.05) in expression as predicted by the microarray. In these examples, exons predicted to have differential expression and exons predicted not to have differential expression were confirmed by qPCR.
Similar articles
- Loss of nuclear TDP-43 in amyotrophic lateral sclerosis (ALS) causes altered expression of splicing machinery and widespread dysregulation of RNA splicing in motor neurones.
Highley JR, Kirby J, Jansweijer JA, Webb PS, Hewamadduma CA, Heath PR, Higginbottom A, Raman R, Ferraiuolo L, Cooper-Knock J, McDermott CJ, Wharton SB, Shaw PJ, Ince PG. Highley JR, et al. Neuropathol Appl Neurobiol. 2014 Oct;40(6):670-85. doi: 10.1111/nan.12148. Neuropathol Appl Neurobiol. 2014. PMID: 24750229 - Motor neurons from ALS patients with mutations in C9ORF72 and SOD1 exhibit distinct transcriptional landscapes.
Wong CO, Venkatachalam K. Wong CO, et al. Hum Mol Genet. 2019 Aug 15;28(16):2799-2810. doi: 10.1093/hmg/ddz104. Hum Mol Genet. 2019. PMID: 31107959 Free PMC article. - RNA-seq analyses reveal that cervical spinal cords and anterior motor neurons from amyotrophic lateral sclerosis subjects show reduced expression of mitochondrial DNA-encoded respiratory genes, and rhTFAM may correct this respiratory deficiency.
Ladd AC, Brohawn DG, Thomas RR, Keeney PM, Berr SS, Khan SM, Portell FR, Shakenov MZ, Antkowiak PF, Kundu B, Tustison N, Bennett JP. Ladd AC, et al. Brain Res. 2017 Jul 15;1667:74-83. doi: 10.1016/j.brainres.2017.05.010. Epub 2017 May 13. Brain Res. 2017. PMID: 28511992 - [Gene expression profile of spinal ventral horn in ALS].
Yamamoto M, Tanaka F, Sobue G. Yamamoto M, et al. Brain Nerve. 2007 Oct;59(10):1129-39. Brain Nerve. 2007. PMID: 17969353 Review. Japanese. - The role of RNA processing in the pathogenesis of motor neuron degeneration.
Bäumer D, Ansorge O, Almeida M, Talbot K. Bäumer D, et al. Expert Rev Mol Med. 2010 Jul 20;12:e21. doi: 10.1017/S1462399410001523. Expert Rev Mol Med. 2010. PMID: 20642879 Review.
Cited by
- ALS-implicated protein TDP-43 sustains levels of STMN2, a mediator of motor neuron growth and repair.
Klim JR, Williams LA, Limone F, Guerra San Juan I, Davis-Dusenbery BN, Mordes DA, Burberry A, Steinbaugh MJ, Gamage KK, Kirchner R, Moccia R, Cassel SH, Chen K, Wainger BJ, Woolf CJ, Eggan K. Klim JR, et al. Nat Neurosci. 2019 Feb;22(2):167-179. doi: 10.1038/s41593-018-0300-4. Epub 2019 Jan 14. Nat Neurosci. 2019. PMID: 30643292 Free PMC article. - Label-Free LC-MS/MS Proteomic Analysis of Cerebrospinal Fluid Identifies Protein/Pathway Alterations and Candidate Biomarkers for Amyotrophic Lateral Sclerosis.
Collins MA, An J, Hood BL, Conrads TP, Bowser RP. Collins MA, et al. J Proteome Res. 2015 Nov 6;14(11):4486-501. doi: 10.1021/acs.jproteome.5b00804. Epub 2015 Oct 8. J Proteome Res. 2015. PMID: 26401960 Free PMC article. - Cytosolic localization of Fox proteins in motor neurons of G93A SOD1 mice.
Ma X, Turnbull PC, Crapper EP, Wang H, Drannik A, Jiang F, Xia S, Turnbull J. Ma X, et al. Histochem Cell Biol. 2016 May;145(5):545-59. doi: 10.1007/s00418-015-1393-4. Epub 2016 Jan 2. Histochem Cell Biol. 2016. PMID: 26724814 - Gene expression profiling in human neurodegenerative disease.
Cooper-Knock J, Kirby J, Ferraiuolo L, Heath PR, Rattray M, Shaw PJ. Cooper-Knock J, et al. Nat Rev Neurol. 2012 Sep;8(9):518-30. doi: 10.1038/nrneurol.2012.156. Epub 2012 Aug 14. Nat Rev Neurol. 2012. PMID: 22890216 Review. - TDP-43-stratified single-cell proteomics of postmortem human spinal motor neurons reveals protein dynamics in amyotrophic lateral sclerosis.
Guise AJ, Misal SA, Carson R, Chu JH, Boekweg H, Van Der Watt D, Welsh NC, Truong T, Liang Y, Xu S, Benedetto G, Gagnon J, Payne SH, Plowey ED, Kelly RT. Guise AJ, et al. Cell Rep. 2024 Jan 23;43(1):113636. doi: 10.1016/j.celrep.2023.113636. Epub 2024 Jan 5. Cell Rep. 2024. PMID: 38183652 Free PMC article.
References
- Rowland L.P., Shneider N.A. Amyotrophic lateral sclerosis. N. Engl. J. Med. 2001;344:1688–1700. - PubMed
- Bruijn L.I., Miller T.M., Cleveland D.W. Unraveling the mechanisms involved in motor neuron degeneration in ALS. Annu. Rev. Neurosci. 2004;27:723–749. - PubMed
- Boillee S., Vande Velde C., Cleveland D.W. ALS: a disease of motor neurons and their nonneuronal neighbors. Neuron. 2006;52:39–59. - PubMed
- Neusch C., Bähr M., Schneider-Gold C. Glia cells in amyotrophic lateral sclerosis: new clues to understanding an old disease? Muscle Nerve. 2007;35:712–724. - PubMed
Publication types
MeSH terms
LinkOut - more resources
Full Text Sources
Other Literature Sources
Medical
Molecular Biology Databases
Miscellaneous


