MEK1 mutations confer resistance to MEK and B-RAF inhibition - PubMed (original) (raw)
Comparative Study
. 2009 Dec 1;106(48):20411-6.
doi: 10.1073/pnas.0905833106. Epub 2009 Nov 13.
Krishna G Vijayendran, Marie C Zipser, Allison M Sawyer, Lili Niu, Jessica J Kim, Charles Hatton, Rajiv Chopra, Patrick A Oberholzer, Maria B Karpova, Laura E MacConaill, Jianming Zhang, Nathanael S Gray, William R Sellers, Reinhard Dummer, Levi A Garraway
Affiliations
- PMID: 19915144
- PMCID: PMC2777185
- DOI: 10.1073/pnas.0905833106
Comparative Study
MEK1 mutations confer resistance to MEK and B-RAF inhibition
Caroline M Emery et al. Proc Natl Acad Sci U S A. 2009.
Erratum in
- Correction to Supporting Information for Emery et al., MEK1 mutations confer resistance to MEK and B-RAF inhibition.
[No authors listed] [No authors listed] Proc Natl Acad Sci U S A. 2024 May 21;121(21):e2406121121. doi: 10.1073/pnas.2406121121. Epub 2024 May 16. Proc Natl Acad Sci U S A. 2024. PMID: 38753518 Free PMC article. No abstract available.
Abstract
Genetic alterations that activate the mitogen-activated protein kinase (MAP kinase) pathway occur commonly in cancer. For example, the majority of melanomas harbor mutations in the BRAF oncogene, which are predicted to confer enhanced sensitivity to pharmacologic MAP kinase inhibition (e.g., RAF or MEK inhibitors). We investigated the clinical relevance of MEK dependency in melanoma by massively parallel sequencing of resistant clones generated from a MEK1 random mutagenesis screen in vitro, as well as tumors obtained from relapsed patients following treatment with AZD6244, an allosteric MEK inhibitor. Most mutations conferring resistance to MEK inhibition in vitro populated the allosteric drug binding pocket or alpha-helix C and showed robust ( approximately 100-fold) resistance to allosteric MEK inhibition. Other mutations affected MEK1 codons located within or abutting the N-terminal negative regulatory helix (helix A), which also undergo gain-of-function germline mutations in cardio-facio-cutaneous (CFC) syndrome. One such mutation, MEK1(P124L), was identified in a resistant metastatic focus that emerged in a melanoma patient treated with AZD6244. Both MEK1(P124L) and MEK1(Q56P), which disrupts helix A, conferred cross-resistance to PLX4720, a selective B-RAF inhibitor. However, exposing BRAF-mutant melanoma cells to AZD6244 and PLX4720 in combination prevented emergence of resistant clones. These results affirm the importance of MEK dependency in BRAF-mutant melanoma and suggest novel mechanisms of resistance to MEK and B-RAF inhibitors that may have important clinical implications.
Conflict of interest statement
The authors declare no conflict of interest.
Figures
Fig. 1.
Candidate MEK1 resistance mutations. (A) The average variant score of candidate mutations across the MEK1 coding sequence from the AZD6244 mutagenesis screen (based on one lane of Illumina sequencing) is shown. The corresponding amino acid substitutions from high scoring mutations (>15%) are indicated in bold. (B) The locations of putative MEK1 inhibitor resistance alleles are indicated within the crystal structure of MEK1 (blue). Both ATP and an arylamine MEK inhibitor (PD318088; purple) are shown to bind MEK1; this inhibitor chemotype binds a hydrophobic pocket adjacent to the ATP binding site. Helix C (green) and helix A (red) are indicated. Mutations within the MEK1 allosteric binding pocket (C), along or adjacent to helix C, are shown in green (D) or within/interfacing with helix A, are shown in red as a protein surface (E).
Fig. 2.
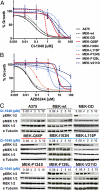
Functional characterization of MEK1 resistance mutations identified in vitro. Growth inhibition curves of parental A375 (solid black), A375 cells expressing primary or secondary MEK1 resistance alleles, a constitutive active MEK variant (MEK-DD; grey), or wild-type MEK1 (hatched black) are shown for CI-1040 (A) or AZD6244 (B). (C) The levels of pERK1/2, pMEK1/2, MEK1/2, and α-tubulin are shown for A375 cells expressing MEK1 mutations following 16-hour incubation with CI-1040 at 10 μM, 5 μM, 2 μM, 0.4 μM, 0.08 μM, and 0 μM.
Fig. 3.
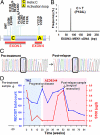
An acquired MEK1 mutation in AZD6244-resistant metastatic melanoma. PCR products corresponding to MEK1 exons 3 and 6 (A) were generated from relapsed melanomas treated with AZD6244; products were pooled and interrogated by massively parallel sequencing (a single Illumina lane). (B) A single mutation, MEK1P124L, was recovered by this analysis. (C) Sanger sequencing chromatograms from MEK1 exon 3 corresponding to pretreatment and postrelapse melanoma DNA from patient 7 are shown. A C > T transition, indicative of MEK1P124L, is evident only in the relapsed sample. (D) Changes in RECIST total count (blue graph) and serum S100 levels (red graph) are plotted over the clinical course of patient 7. The times of pretreatment and postrelapse biopsies are indicated. The intervals of temozolomide treatment (shaded blue) and AZD6244 treatment (shaded pink) are shown.
Fig. 4.
Ex vivo and functional characterization of MEK1(P124L). (A) AZD6244-mediated growth inhibition ex vivo of treatment-naïve BRAFV600E melanoma cells (black and blue) or cells cultured from an AZD6244-resistant metastatic focus (red). (B) ERK phosphorylation (_p_-ERK) and MEK phosphorylation (_p_-MEK) are shown following treatment with increasing concentrations of AZD6244 in treatment-naïve or AZD6244-resistant melanoma cells cultured ex vivo. The tubulin loading control (α-tubulin) is also shown. (C) AZD6244 growth inhibition curves of parental A375 (solid black), A375 cells expressing MEK-DD (grey), wild-type MEK1 (hatched black), or MEK1(P124L) (red) are shown. In each instance n = 6 and ± error = standard deviation. (D) _p_-ERK and _p_-MEK are shown following treatment with increasing AZD6244 concentrations in the cell lines described in C, Above. The α-tubulin control is also shown.
Fig. 5.
Effects of B-RAF and combined MEK/BRAF inhibition on MEK1 resistance alleles. (A) PLX4720-mediated growth inhibition curves are shown for ex vivo cultures of treatment-naïve B-RAFV600E melanoma cells (black) or cells cultured from an AZD6244-resistant metastatic focus (red). (B) PLX4720 growth inhibition curves are shown for parental A375 cells (solid black) and A375 cells expressing selected primary MEK1 resistance alleles (blue), MEK-DD (grey), wild-type MEK1 (hatched black), MEK1(Q56P), or MEK1(P124L) (red). In each instance, n = 6 and ± error = standard deviation. (C) Colony formation assays are shown for parental A375 (red bars) and cells expressing empty vector (orange bars), MEK-WT (green bars), MEK(DD) (pink bars), or MEK(P124L) (blue bars), as indicated in the legend Inset. Concentrations of AZD6244 and PLX4720 (μM) are indicated (Below). _y_-axis indicates the number of dense colonies formed compared to the vehicle control for each case. n = 3 and ± error = standard deviation.
Similar articles
- Novel ATP-competitive MEK inhibitor E6201 is effective against vemurafenib-resistant melanoma harboring the MEK1-C121S mutation in a preclinical model.
Narita Y, Okamoto K, Kawada MI, Takase K, Minoshima Y, Kodama K, Iwata M, Miyamoto N, Sawada K. Narita Y, et al. Mol Cancer Ther. 2014 Apr;13(4):823-32. doi: 10.1158/1535-7163.MCT-13-0667. Epub 2014 Jan 21. Mol Cancer Ther. 2014. PMID: 24448821 - BRAF-inhibitor Associated MEK Mutations Increase RAF-Dependent and -Independent Enzymatic Activity.
Emery CM, Monaco KA, Wang P, Balak M, Freeman A, Meltzer J, Delach SM, Rakiec D, Ruddy DA, Korn JM, Haling J, Acker MG, Caponigro G. Emery CM, et al. Mol Cancer Res. 2017 Oct;15(10):1431-1444. doi: 10.1158/1541-7786.MCR-17-0211. Epub 2017 Jun 27. Mol Cancer Res. 2017. PMID: 28655712 - Amplification of the driving oncogene, KRAS or BRAF, underpins acquired resistance to MEK1/2 inhibitors in colorectal cancer cells.
Little AS, Balmanno K, Sale MJ, Newman S, Dry JR, Hampson M, Edwards PA, Smith PD, Cook SJ. Little AS, et al. Sci Signal. 2011 Mar 29;4(166):ra17. doi: 10.1126/scisignal.2001752. Sci Signal. 2011. PMID: 21447798 Corrected and republished. - Tumor Cell Resistance to the Inhibition of BRAF and MEK1/2.
Chen W, Park JI. Chen W, et al. Int J Mol Sci. 2023 Oct 2;24(19):14837. doi: 10.3390/ijms241914837. Int J Mol Sci. 2023. PMID: 37834284 Free PMC article. Review. - Cobimetinib: inhibiting MEK1/2 in BRAF V600-mutant melanoma.
Eagles JR, Jimeno A. Eagles JR, et al. Drugs Today (Barc). 2016 Nov;52(11):593-605. doi: 10.1358/dot.2016.52.11.2542234. Drugs Today (Barc). 2016. PMID: 28112278 Review.
Cited by
- Novel treatments for metastatic cutaneous melanoma and the management of emergent toxicities.
Lemech C, Arkenau HT. Lemech C, et al. Clin Med Insights Oncol. 2012;6:53-66. doi: 10.4137/CMO.S5855. Epub 2012 Jan 5. Clin Med Insights Oncol. 2012. PMID: 22253555 Free PMC article. - Phase II trial of MEK inhibitor selumetinib (AZD6244, ARRY-142886) in patients with BRAFV600E/K-mutated melanoma.
Catalanotti F, Solit DB, Pulitzer MP, Berger MF, Scott SN, Iyriboz T, Lacouture ME, Panageas KS, Wolchok JD, Carvajal RD, Schwartz GK, Rosen N, Chapman PB. Catalanotti F, et al. Clin Cancer Res. 2013 Apr 15;19(8):2257-64. doi: 10.1158/1078-0432.CCR-12-3476. Epub 2013 Feb 26. Clin Cancer Res. 2013. PMID: 23444215 Free PMC article. Clinical Trial. - Targeted therapy and immunotherapy in advanced melanoma: an evolving paradigm.
Khattak M, Fisher R, Turajlic S, Larkin J. Khattak M, et al. Ther Adv Med Oncol. 2013 Mar;5(2):105-18. doi: 10.1177/1758834012466280. Ther Adv Med Oncol. 2013. PMID: 23450149 Free PMC article. - Resistance to Targeted Therapy and RASSF1A Loss in Melanoma: What Are We Missing?
McKenna S, García-Gutiérrez L. McKenna S, et al. Int J Mol Sci. 2021 May 12;22(10):5115. doi: 10.3390/ijms22105115. Int J Mol Sci. 2021. PMID: 34066022 Free PMC article. Review. - Determinants of resistance and response to melanoma therapy.
Robertson BM, Fane ME, Weeraratna AT, Rebecca VW. Robertson BM, et al. Nat Cancer. 2024 Jul;5(7):964-982. doi: 10.1038/s43018-024-00794-1. Epub 2024 Jul 17. Nat Cancer. 2024. PMID: 39020103 Review.
References
- Martin GS. Cell signaling and cancer. Cancer Cell. 2003;4:167–174. - PubMed
- Weinstein IB. Cancer. Addiction to oncogenes—the Achilles heal of cancer. Science. 2002;297:63–64. - PubMed
- Davies H, et al. Mutations of the BRAF gene in human cancer. Nature. 2002;417:949–954. - PubMed
Publication types
MeSH terms
Substances
Grants and funding
- K08CA115927/CA/NCI NIH HHS/United States
- P50 CA093683/CA/NCI NIH HHS/United States
- K08 CA115927/CA/NCI NIH HHS/United States
- WT_/Wellcome Trust/United Kingdom
- P50CA093683/CA/NCI NIH HHS/United States
- DP2OD002750/OD/NIH HHS/United States
- DP2 OD002750/OD/NIH HHS/United States
LinkOut - more resources
Full Text Sources
Other Literature Sources
Medical
Research Materials
Miscellaneous


