Role of STAT5 in controlling cell survival and immunoglobulin gene recombination during pro-B cell development - PubMed (original) (raw)
Role of STAT5 in controlling cell survival and immunoglobulin gene recombination during pro-B cell development
Stephen Malin et al. Nat Immunol. 2010 Feb.
Abstract
STAT5 and interleukin 7 (IL-7) signaling are thought to control B lymphopoiesis by regulating the expression of key transcription factors and by activating variable (V(H)) gene segments at the immunoglobulin heavy-chain (Igh) locus. Using conditional mutagenesis to delete the gene encoding the transcription factor STAT5, we demonstrate that the development of pro-B cells was restored by transgenic expression of the prosurvival protein Bcl-2, which compensated for loss of the antiapoptotic protein Mcl-1. Expression of the genes encoding the B cell-specification factor EBF1 and the B cell-commitment protein Pax5 as well as V(H) gene recombination were normal in STAT5- or IL-7 receptor alpha-chain (IL-7Ralpha)-deficient pro-B cells rescued by Bcl-2. STAT5-expressing pro-B cells contained little or no active chromatin at most V(H) genes. In contrast, rearrangements of the immunoglobulin-kappa light-chain locus (Igk) were more abundant in STAT5- or IL-7Ralpha-deficient pro-B cells. Hence, STAT5 and IL-7 signaling control cell survival and the developmental ordering of immunoglobulin gene rearrangements by suppressing premature Igk recombination in pro-B cells.
Conflict of interest statement
COMPETING INTERESTS STATEMENT The authors declare that they have no competing financial interests.
Figures
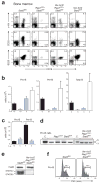
Figure 1. Rescue of STAT5-deficient pro-B cells by transgenic Bcl-2 expression
(a-c) Restoration of pro-B cell development by compensation of the STAT5 deficiency with transgenic Bcl-2 expression. Flow cytometric analysis (a) and cell counting were used to determine the absolute cell numbers (b,c) of pro-B (c-Kit+CD19+IgM−), pre-B (CD25+CD19+IgM−) and total B cells (B220+CD19+) in the bone marrow of Rag1cre/+ Stat5fl/fl (grey bar) and Vav-bcl2 Rag1cre/+ Stat5fl/fl mice (blue bar) compared to control Stat5fl/fl (black bar) and Vav-bcl2 Stat5fl/fl mice (white bar) at the age of 4-6 weeks. Bone marrow was isolated from the femur and tibia of the two hind legs. n, number of mice analyzed. (c) Reanalysis of the absolute numbers of pro-B and pre-B cells (b) revealed the absence of proliferative cell expansion during the pro-B to pre-B cell transition in Vav-bcl2 Rag1cre/+ Stat5fl/fl mice compared to control_Stat5fl/fl_ mice. (d) PCR genotyping of the floxed (fl) and deleted (Δ) Stat5 alleles in sorted pro-B cells from the bone marrow of 4_Rag1cre/+ Stat5fl/fl_ and 3 Vav-bcl2 Rag1cre/+ Stat5fl/fl mice. Genomic_Stat5fl/Δ_ DNA was used as control (C). (e) Immunoblot analysis of sorted CD19+ bone marrow B cells of the indicated genotypes with a mixture of STAT5A and STAT5B antibodies or a control Hsp90 antibody. (f) Size distribution of pro-B cells of the indicated genotypes, as determined by their forward scatter (FSC) profile.
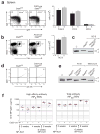
Figure 2. Normal development and immune responses of mature B cells in the absence of STAT5
(a) Normal development of mature (IgDhiIgMloCD19+), follicular (FO; CD21intCD23hi) and marginal zone (MZ; CD21hiCD23lo) B cells in the spleen of nonimmunized Cd23-cre Stat5fl/fl mice (grey bar) compared to control Stat5fl/fl mice (black bar) at the age of 8-10 weeks. Note that the Cd23-cre line 5 initiates Cre-mediated gene deletion in immature B cells and results in complete deletion in MZ and FO B cells of the spleen. Absolute numbers of the different B cell types and total B cells (CD19+B220+) are shown to the right together with the number (n) of mice analyzed. (b) Normal GC B cell formation in Aicda-cre Stat5fl/fl mice. The abundance of GC B cells (Fas+B220+) in control_Stat5fl/fl_ (back bar) and_Aicda-cre Stat5fl/fl_ (grey bar) mice was determined by flow cytometric analysis 15 days after immunization with sheep red blood cells. n, number of mice analyzed. (c) Efficient deletion of Stat5 in sorted GC B cells of Aicda-cre Stat5fl/fl mice 15 days after immunization. Genomic Stat5fl/Δ DNA was used as control (C). (d) Presence of memory B cells in the spleen of_Cd23-cre Stat5fl/fl_ 8 weeks after the initial immunization with NP-KLH (100 μg in Alum) and 2 weeks after boosting with NP-KLH (10 μg in PBS). Memory B cells were identified as Lin−CD38hiB220+CD19+IgG1+NP+ cells as shown in Supplementary Fig. 8. (e) PCR genotyping of the floxed (fl) and deleted (Δ) Stat5 alleles in sorted FO and memory B cells from mice of the indicated genotypes. (f) NP-specific immune responses. Control Stat5fl/fl (−) and Cd23-cre Stat5fl/fl (+) mice were immunized with NP-KLH (100 μg in Alum) and boosted with NP-KLH (10 μg in PBS) 6 weeks later. After 2, 4 and 8 weeks, the serum titers of NP-specific antibodies were determined by ELISA using NP3-BSA- or NP30-BSA-coated plates for detecting high-affinity or total IgG1 antibodies, respectively. NP-specific IgG1 concentrations (μg/ml) were determined relative to a standard NP-binding IgG1 antibody.
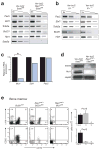
Figure 3. STAT5 controls the survival of pro-B cells by activating the Mcl1 gene
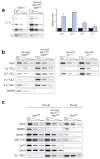
(a,b) Normal expression of B cell transcription factor genes in the absence of STAT5 (a) or IL-7R signaling (b). Expression of the indicated genes was determined by semiquantitative RT-PCR analysis using 5-fold serial dilutions of cDNA prepared from FACS-sorted pro-B cells (Supplementary Fig. 10) of 4-6-week-old mice of the indicated genotypes.Tcfe2a (E2A); Bcl2l1 (Bcl-x). (c) Reduced Mcl1 expression in STAT5-deficient pro-B cells. Transcripts of the indicated genes were analyzed by real-time RT-PCR of cDNA prepared from sorted pro-B cells of control Vav-bcl2 Stat5fl/fl (black bar) and_Vav-bcl2 Rag1cre/+ Stat5fl/fl_ (blue bar) mice. The transcript levels of control pro-B cells were set to 100%. Statistical significance was determined by the student’s t test (*, p < 0.05). (d) Loss of Mcl-1 expression in the absence of STAT5. Whole cell extracts of sorted CD19+ bone marrow cells from mice of the indicated genotypes were analyzed by immunoblot analysis with STAT5, Mcl-1 and Hsp90 antibodies. (e) Distinct functions of Mcl1 and Bcl2l1 in early B cell development. Pro-B and pre-B cells were analyzed by flow cytometric analysis in the bone marrow of control_Bcl2l1fl/fl_ (black bar),Rag1cre/+ Bcl2l1fl/fl (grey bar) and Rag1cre/+ Mcl1fl/fl mice (denoted by 0). Absolute cell numbers are shown to the right together with the number (n) of mice analyzed. A more comprehensive FACS analysis is shown in Supplementary Fig. 12.
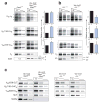
Figure 4. Normal Igh gene recombination in pro-B cells lacking STAT5 or IL-7Rα
(a) PCR analysis of DH-JH, VH7183-DJH and VHJ558-DJH rearrangements in c-Kit+CD19+IgM− pro-B cells, which were FACS-sorted from the bone marrow of control_Stat5+/+_ (black bar) and_Vav-bcl2 Rag1cre/+ Stat5fl/fl_ mice (blue bar) at the age of 4-6 weeks as described in Supplementary Fig. 10. Input DNA was normalized by PCR amplification of an Igh Cμ fragment. Threefold serial DNA dilutions were analyzed by semiquantitative PCR and Southern blotting. The radioactive signals of each rearrangement type were quantified for each DNA dilution by phosphorimager analysis and normalized relative to the corresponding value of the Cμ PCR fragment. For each experiment, the average of the normalized signals obtained with the three DNA dilutions was determined, and the average value of all experiments is displayed as a bar graph for each rearrangement type to the right. The average values obtained with wild-type (Stat5+/+) pro-B cells were set to 1, and the number (n) of independent experiments is shown. Numbers along the left margin indicate rearrangements to the JH1, JH2 and JH3 gene segments. n.a., not applicable. (b) PCR analysis of Igh rearrangements in sorted pro-B cells from 4-6-week-old_Il7r+/+_ (black bar) and_Vav-bcl2 Il7r_−/− mice (blue bar) was performed and evaluated as described in (a). (c) RT-PCR analysis. Expression of the VHJ558 germline transcripts (GLT) as well as the rearranged VH7183-DJCμ and VHJ558-DJμ transcripts was analyzed by semiquantitative RT-PCR analysis using 5-fold serial dilutions of cDNA prepared from FACS-sorted pro-B cells of the indicated genotypes.
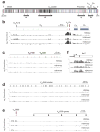
Figure 5. Mapping of active histone modifications along the Igh locus in _Rag2_−/− pro-B cells
(a) Structure of the Igh locus indicating the location of variable (VH), diversity (DH), joining (JH) and constant (CH) gene segments together with the intronic (Eμ) enhancer, the 5’ DNase I hypersensitive sites (red) and 3’ regulatory region (3’RR; red). Different colors indicate the members of distinct VH gene families, of which the VHJ558 (black), VH3609 (pink), VHQ52 (green) and VH7183 (rosa) genes are relevant for this study. The diagram of the Igh locus is based on the mm8 genome sequence and the published VH gene assembly of the C57BL/6 mouse. (b-f) Mapping of active chromatin marks in the DH-Cμ domain (b) and representative proximal (c) and distal (d,e) VH gene regions of the Igh locus as well as at the 5’ end of the Ikzf1 (Ikaros) gene (f) in _Rag2_−/− pro-B cells. Antibodies recognizing acetylated lysine 9 (H3K9ac), dimethylated lysine 4 (H3K4me2) or trimethylated lysine 4 (H3K4me3) on histone H3 were used for ChIP-chip analysis of _Rag2_−/− bone marrow pro-B cells, which were expanded in vitro for 5 days in the presence of IL-7 and OP9 stromal cells. The ChIP-precipitated DNA was amplified with the T7-based linear amplification protocol prior to fluorescent labeling and co-hybridization with the input DNA probe onto a high-density 50-mer oligonucleotide array containing the mouse Igh locus at 100-bp resolution (produced by NimbleGen Systems). The logarithmic ratio (log2) of the hybridization intensities between antibody-precipitated and input DNA (bound/input) is shown as a bar for each oligonucleotide on the microarray. The results shown are representative of two ChIP-chip experiments, which were performed with independently prepared DNA probes from Rag2_−/− pro-B cells. A scale bar is shown in kb. Supplementary Fig. 15 shows the result of a similar ChIP-chip analysis, which was performed with DNA probes amplified with the WGA method. The mm8 sequence coordinates for the displayed regions of the_Igh locus on chromosome 12 are 116,520,000-113,586,000 (a), 113,938,000-113,852,500 (b), 114,234,000-114,086,000 (c), 115,441,500-115,087,000 (d) and 115,859,000-115,780,000 (e).
Figure 6. Distribution of active histone marks along the VH gene cluster in _Rag2_−/− pro-B cells
Peak-finder analysis was used to systematically evaluate the ChIP-chip data, which were obtained with linearly amplified (a) or WGA-amplified (b) probes as shown in Fig. 5 and Supplementary Fig. 15, respectively. The number of VH genes, which contained a peak of H3K4me2 (black bar) or H3K9ac (gray bar) above the threshold of the peak-finder analysis, are shown together with the number of all genes of each VH gene family that were present on the microarray. The VH gene families are arranged according to their position in the Igh locus. The number of all annotated genes is shown in brackets (b) for each VH gene family of the C57BL/6 mouse.
Figure 7. STAT5 and IL-7 signaling repress Igk and Igl gene rearrangements in pro-B cells
(a) Increased Igk gene rearrangements in pro-B cells sorted from Vav-bcl2 Rag1cre/+ Stat5fl/fl mice (blue bar) compared to wild-type mice (black bar). Vκ gene rearrangements to the Jκ1 to Jκ5 gene segments (indicated by numbers along the left margin) were analyzed by semiquantitative PCR of 3-fold serially diluted DNA followed by Southern blot detection. The radioactive signals corresponding to these rearrangements were quantified by phosphorimager analysis, normalized to the value of the control Cμ PCR fragment and displayed in the bar graph to the right. The normalized value obtained for each Vκ-Jκ rearrangement in wild-type pro-B cells was set to 1. The quantification of 3 independent experiments is shown. (b) RT-PCR analysis of Igk transcripts. The expression of rearranged Vκ-JCκ and Vλ1-JCλ transcripts as well as the two κo germline transcripts (GLT) were analyzed by semiquantitative RT-PCR using 5-fold serial dilutions of cDNA prepared from FACS-sorted pro-B cells of the indicated genotypes. The 5’ and 3’ κo GLTs are transcribed from distinct promoters (see Supplementary Fig. 18a) and give rise to 1.1-kb and 0.8-kb spliced transcripts, respectively. (c) Expression of pro-B cell-specific genes in Bcl-2-rescued STAT5-deficient pro-B cells. FACS-sorted pro-B cells (c-Kit+CD19+CD25−IgM−) and pre-B cells (CD19+CD25+c-Kit−IgM−) of control Stat5+/+ or_Vav-bcl2 Rag1cre/+ Stat5fl/fl_ mice were analyzed by semiquantitative RT-PCR for expression of the ‘pro-B cell-specific’ genes_Vpreb1, Igll1_ (λ5), Lef1 and_Dntt_ (TdT) and the ‘pre-B cell-specific’ 3’ κo GLT.
Similar articles
- STAT5 in B cell development and leukemia.
Malin S, McManus S, Busslinger M. Malin S, et al. Curr Opin Immunol. 2010 Apr;22(2):168-76. doi: 10.1016/j.coi.2010.02.004. Epub 2010 Mar 11. Curr Opin Immunol. 2010. PMID: 20227268 Review. - Regulation of interleukin 7-dependent immunoglobulin heavy-chain variable gene rearrangements by transcription factor STAT5.
Bertolino E, Reddy K, Medina KL, Parganas E, Ihle J, Singh H. Bertolino E, et al. Nat Immunol. 2005 Aug;6(8):836-43. doi: 10.1038/ni1226. Epub 2005 Jul 17. Nat Immunol. 2005. PMID: 16025120 - The survival and differentiation of pro-B and pre-B cells in the bone marrow is dependent on IL-7Rα Tyr449.
Patton DT, Plumb AW, Abraham N. Patton DT, et al. J Immunol. 2014 Oct 1;193(7):3446-55. doi: 10.4049/jimmunol.1302925. Epub 2014 Aug 20. J Immunol. 2014. PMID: 25143441 - Pax5 induces V-to-DJ rearrangements and locus contraction of the immunoglobulin heavy-chain gene.
Fuxa M, Skok J, Souabni A, Salvagiotto G, Roldan E, Busslinger M. Fuxa M, et al. Genes Dev. 2004 Feb 15;18(4):411-22. doi: 10.1101/gad.291504. Genes Dev. 2004. PMID: 15004008 Free PMC article. - Orchestrating B cell lymphopoiesis through interplay of IL-7 receptor and pre-B cell receptor signalling.
Clark MR, Mandal M, Ochiai K, Singh H. Clark MR, et al. Nat Rev Immunol. 2014 Feb;14(2):69-80. doi: 10.1038/nri3570. Epub 2013 Dec 31. Nat Rev Immunol. 2014. PMID: 24378843 Free PMC article. Review.
Cited by
- The BH3-only protein BIM contributes to late-stage involution in the mouse mammary gland.
Schuler F, Baumgartner F, Klepsch V, Chamson M, Müller-Holzner E, Watson CJ, Oh S, Hennighausen L, Tymoszuk P, Doppler W, Villunger A. Schuler F, et al. Cell Death Differ. 2016 Jan;23(1):41-51. doi: 10.1038/cdd.2015.61. Epub 2015 Jun 5. Cell Death Differ. 2016. PMID: 26045049 Free PMC article. - The Zinc-finger protein ASCIZ regulates B cell development via DYNLL1 and Bim.
Jurado S, Gleeson K, O'Donnell K, Izon DJ, Walkley CR, Strasser A, Tarlinton DM, Heierhorst J. Jurado S, et al. J Exp Med. 2012 Aug 27;209(9):1629-39. doi: 10.1084/jem.20120785. Epub 2012 Aug 13. J Exp Med. 2012. PMID: 22891272 Free PMC article. - mTORC1 as a cell-intrinsic rheostat that shapes development, preimmune repertoire, and function of B lymphocytes.
Raybuck AL, Lee K, Cho SH, Li J, Thomas JW, Boothby MR. Raybuck AL, et al. FASEB J. 2019 Dec;33(12):13202-13215. doi: 10.1096/fj.201900069R. Epub 2019 Sep 18. FASEB J. 2019. PMID: 31533002 Free PMC article. - The NAMPT promoter is regulated by mechanical stress, signal transducer and activator of transcription 5, and acute respiratory distress syndrome-associated genetic variants.
Sun X, Elangovan VR, Mapes B, Camp SM, Sammani S, Saadat L, Ceco E, Ma SF, Flores C, MacDougall MS, Quijada H, Liu B, Kempf CL, Wang T, Chiang ET, Garcia JG. Sun X, et al. Am J Respir Cell Mol Biol. 2014 Nov;51(5):660-7. doi: 10.1165/rcmb.2014-0117OC. Am J Respir Cell Mol Biol. 2014. PMID: 24821571 Free PMC article. - Integrated signaling in developing lymphocytes: the role of DNA damage responses.
Bednarski JJ, Sleckman BP. Bednarski JJ, et al. Cell Cycle. 2012 Nov 15;11(22):4129-34. doi: 10.4161/cc.22021. Epub 2012 Oct 3. Cell Cycle. 2012. PMID: 23032308 Free PMC article.
References
- Maraskovsky E, et al. Bcl-2 can rescue T lymphocyte development in interleukin-7 receptor-deficient mice but not in mutant rag-1−/− mice. Cell. 1997;89:1011–1019. - PubMed
- Akashi K, Kondo M, von Freeden-Jeffry U, Murray R, Weissman IL. Bcl-2 rescues T lymphopoiesis in interleukin-7 receptor-deficient mice. Cell. 1997;89:1033–1041. - PubMed
Publication types
MeSH terms
Substances
LinkOut - more resources
Full Text Sources
Other Literature Sources
Molecular Biology Databases
Miscellaneous
