Endothelial cells isolated from caveolin-2 knockout mice display higher proliferation rate and cell cycle progression relative to their wild-type counterparts - PubMed (original) (raw)
Endothelial cells isolated from caveolin-2 knockout mice display higher proliferation rate and cell cycle progression relative to their wild-type counterparts
Leike Xie et al. Am J Physiol Cell Physiol. 2010 Mar.
Abstract
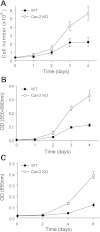
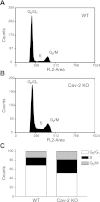
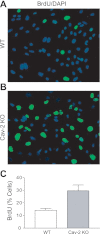
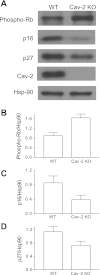
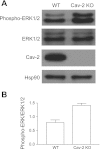
The goal of this study was to determine whether caveolin-2 (Cav-2) is capable of controlling endothelial cell (EC) proliferation in vitro. To realize this goal, we have directly compared proliferation rates and cell cycle-associated signaling proteins between lung ECs isolated from wild-type (WT) and Cav-2 knockout (KO) mice. Using three independent proliferation assays, we have determined that Cav-2 KO ECs proliferate by ca. 2-fold faster than their WT counterparts. Cell cycle analysis by flow cytometry of propidium iodide-stained cells showed a relatively higher percentage of Cav-2 KO ECs in S and G(2)/M and lower percentage in G(o)/G(1) phases of cell cycle relative to their WT counterparts. Furthermore, an over 2-fold increase in the percentage of S phase-associated Cav-2 KO relative to WT ECs was independently determined with bromodeoxyuridine incorporation assay. Mechanistically, the increase in proliferation/cell cycle progression of Cav-2 KO ECs correlated well with elevated expression levels of predominantly S phase- and G(2)/M phase-associated cyclin A and B1, respectively. Further mechanistic analysis of molecular events controlling cell cycle progression revealed increased level of hyperphosphorylated (inactive) form of G(1) to S phase transition inhibitor, the retinoblastoma protein in hyperproliferating Cav-2 KO ECs. Conversely, the expression level of the two cyclin-dependent kinase inhibitors p16(INK4) and p27(Kip1) was reduced in Cav-2 KO ECs. Finally, increased phosphorylation (activation) of proproliferative extracellular signal-regulated kinase 1/2 was observed in hyperproliferating Cav-2 KO ECs. Overall, our data suggest that Cav-2 negatively regulates lung EC proliferation and cell cycle progression.
Figures
Fig. 1.
Isolation and initial characterization of mouse lung endothelial cells (MLECs). A: Western blot characterization of the purity of isolated wild-type (WT) and caveolin-2 (Cav-2) knockout (KO) MLECs relative to “lung cells” remaining after first immunoisolation with anti-platelet endothelial cell adhesion molecule-1 (PECAM-1) antibody. Note that, unlike WT, Cav-2 KO MLECs and lung cells are completely devoid of Cav-2. Both WT and Cav-2 KO MLEC protein lysates are positive for endothelial cell (EC)-specific marker proteins, i.e., Flk-1, PECAM-1, VE-cadherin, and endothelial nitric oxide synthase (eNOS), but negative for the mural cell marker protein α-actin. Conversely, protein lysates from lung cells are negative for EC marker proteins but positive for α-actin. B: immunofluorescent microscopy images of MLECs colabeled with 4′-6-diamidino-2-phenylindole (DAPI; blue nuclear staining) and with antibodies against EC marker proteins: VE-cadherin (green plasma membrane staining) or von Willebrand factor (vWF; green perinuclear staining). Note that all WT and Cav-2 KO cells are VE-cadherin or vWF positive. Hsp-90, heat shock protein 90.
Fig. 2.
Higher proliferation rate in Cav-2 KO relative to WT MLECs. A: direct determination of cell proliferation rate by cell count using hemocytometer. MLECs were plated at 4 × 10⁴ cells per 60-mm dish, and cell numbers were determined at the indicated time points by cell count and are expressed as means ± SD (n = 9). Values are from one representative out of a total of 3 experiments. B: indirect determination of cell proliferation rate by colorimetric assessment of MTT to formazan conversion. MLECs were plated at 2.5 × 10³ cells per well of 96-well plate, and optical density (OD) was measured at the indicated time points using a plate reader with a test wavelength of 550 nm and a reference wavelength of 690 nm to obtain a sample signal (550–690 nm). Data are expressed as means ± SD (n = 3). Values are from one representative out of a total of 4 experiments. C: indirect determination of cellular proliferation rate by colorimetric assessment of cellular DNA staining with methylene blue. MLECs were plated at 5 × 10³ per well in a 96-well plate, and OD was measured at the indicated time points using a plate reader with a test wavelength of 655 nm. Data are expressed as means ± SD (n = 3). Values are from one representative out of a total of 4 experiments.
Fig. 3.
Increased association in hyperproliferating Cav-2 KO MLECs with S and G2/M phases and the concurrent decreased association with G0/G1 phases of cell cycle determined by flow cytometry. WT and Cav-2 KO MLECs were plated at 3 × 10⁵ per 150-mm dish, and 2 days later, harvested with trypsin, fixed in ethanol, stained with propidium iodide, and analyzed by flow cytometry using fluorescent channel 2 (FL2-area). Representative cell cycle profiles from one representative out of a total of 3 experiments are shown for WT (A) and Cav-2 KO MLECs (B). Quantitative assessment of the percentage of cellular population associated with each phase of the cell cycle is illustrated in C.
Fig. 4.
Enhanced S phase association in hyperproliferating Cav-2 KO MLECs determined by BrdU incorporation assay. A and B: WT (A) and Cav-2 KO (B) MLECs were plated at 5 × 10³ per chamber of an 8-chamber glass slide precoated with 0.2% gelatin, and 3 days later, pulsed with 5-bromo-2-deoxyuridine (BrdU) for 2 h. Fixing and immunofluorescence staining with fluorescein isothiocyanate-conjugated anti-BrdU antibody (green) and DAPI (blue) was then performed. Note the considerably higher number of BrdU-positive (green) cells in Cav-2 KO (B) relative to WT MLECs (A). C: % BrdU-positive cells was calculated and data are expressed as means ± SD (n = 5). Values are from one representative out of a total of 3 experiments.
Fig. 5.
Elevated expression levels of S and G2/M phase associated cyclins A and B1 in hyperproliferating Cav-2 KO MLECs relative to their WT counterparts determined by immunoblotting. A: WT and Cav-2 MLECs were plated at 3 × 10⁵ per 150-mm dish, and 2 days later, cells were lysed and SDS-PAGE-resolved protein lysates were immunoblotted with the indicated cyclin-specific antibodies. B_–_E: mean densitometric ratios ± SD (n = 3) of cyclin proteins expression levels to protein loading control Hsp-90. Note a visible increase in the expression levels of cyclins A and B1 but not D1 and E in Cav-2 KO relative to WT MLECs.
Fig. 6.
Increased levels of phosphorylated/inactive form of the Rb protein with concurrent decrease in the expression levels of cyclin-dependent kinase (cdk) inhibitors p27Kip1 and p16INK4 in hyperproliferating Cav-2 KO relative to WT MLECs determined by immunoblotting. A: WT and Cav-2 MLECs were plated at 3 × 10⁵ per 150-mm dish, and 2 days later, lysed and immunoblotted with the indicated antibodies. B: mean densitometric ratios ± SD (n = 3) of phosphorylated (inactive) Rb levels to protein loading control Hsp-90. C and D: mean densitometric ratios ± SD (n = 3) of indicated cdk inhibitors p16INK4 (p16) and p27Kip1 (p27) expression levels to protein loading control Hsp-90.
Fig. 7.
Augmented activation/phosphorylation state of ERK1/2 in hyperproliferating Cav-2 KO relative to WT MLECs determined by immunoblotting. A: WT and Cav-2 KO MLECs were plated at 3 × 10⁵ per 150-mm dish, and 2 days later, were lysed and immunoblotted with the indicated antibodies. B: mean densitometric ratios ± SD (n = 3) of phosphorylated ERK1/2 (phospho-ERK1/2) to total expression level (ERK1/2).
Similar articles
- Caveolin-2 is a negative regulator of anti-proliferative function and signaling of transforming growth factor-β in endothelial cells.
Xie L, Vo-Ransdell C, Abel B, Willoughby C, Jang S, Sowa G. Xie L, et al. Am J Physiol Cell Physiol. 2011 Nov;301(5):C1161-74. doi: 10.1152/ajpcell.00486.2010. Epub 2011 Aug 10. Am J Physiol Cell Physiol. 2011. PMID: 21832243 Free PMC article. - Caveolin-1-deficient aortic smooth muscle cells show cell autonomous abnormalities in proliferation, migration, and endothelin-based signal transduction.
Hassan GS, Williams TM, Frank PG, Lisanti MP. Hassan GS, et al. Am J Physiol Heart Circ Physiol. 2006 Jun;290(6):H2393-401. doi: 10.1152/ajpheart.01161.2005. Epub 2006 Jan 13. Am J Physiol Heart Circ Physiol. 2006. PMID: 16415072 - Combined loss of INK4a and caveolin-1 synergistically enhances cell proliferation and oncogene-induced tumorigenesis: role of INK4a/CAV-1 in mammary epithelial cell hyperplasia.
Williams TM, Lee H, Cheung MW, Cohen AW, Razani B, Iyengar P, Scherer PE, Pestell RG, Lisanti MP. Williams TM, et al. J Biol Chem. 2004 Jun 4;279(23):24745-56. doi: 10.1074/jbc.M402064200. Epub 2004 Mar 25. J Biol Chem. 2004. PMID: 15044451 - [Molecular mechanisms controlling the cell cycle: fundamental aspects and implications for oncology].
Viallard JF, Lacombe F, Belloc F, Pellegrin JL, Reiffers J. Viallard JF, et al. Cancer Radiother. 2001 Apr;5(2):109-29. doi: 10.1016/s1278-3218(01)00087-7. Cancer Radiother. 2001. PMID: 11355576 Review. French.
Cited by
- Critical Role of Caveolin-1 Loss/Dysfunction in Pulmonary Hypertension.
Mathew R. Mathew R. Med Sci (Basel). 2021 Sep 22;9(4):58. doi: 10.3390/medsci9040058. Med Sci (Basel). 2021. PMID: 34698188 Free PMC article. Review. - Lysophosphatidic Acid Stimulates the Proliferation of Ovarian Cancer Cells via the gep Proto-Oncogene Gα(12).
Goldsmith ZG, Ha JH, Jayaraman M, Dhanasekaran DN. Goldsmith ZG, et al. Genes Cancer. 2011 May;2(5):563-75. doi: 10.1177/1947601911419362. Genes Cancer. 2011. PMID: 21901169 Free PMC article. - Caveolin-1 and Caveolin-2 Can Be Antagonistic Partners in Inflammation and Beyond.
de Almeida CJG. de Almeida CJG. Front Immunol. 2017 Nov 17;8:1530. doi: 10.3389/fimmu.2017.01530. eCollection 2017. Front Immunol. 2017. PMID: 29250058 Free PMC article. Review. - N-terminal tyrosine phosphorylation of caveolin-2 negates anti-proliferative effect of transforming growth factor beta in endothelial cells.
Abel B, Willoughby C, Jang S, Cooper L, Xie L, Vo-Ransdell C, Sowa G. Abel B, et al. FEBS Lett. 2012 Sep 21;586(19):3317-23. doi: 10.1016/j.febslet.2012.07.008. Epub 2012 Jul 20. FEBS Lett. 2012. PMID: 22819829 Free PMC article. - Caveolin-2 is a negative regulator of anti-proliferative function and signaling of transforming growth factor-β in endothelial cells.
Xie L, Vo-Ransdell C, Abel B, Willoughby C, Jang S, Sowa G. Xie L, et al. Am J Physiol Cell Physiol. 2011 Nov;301(5):C1161-74. doi: 10.1152/ajpcell.00486.2010. Epub 2011 Aug 10. Am J Physiol Cell Physiol. 2011. PMID: 21832243 Free PMC article.
References
- Aprelikova O, Xiong Y, Liu ET. Both p16 and p21 families of cyclin-dependent kinase (CDK) inhibitors block the phosphorylation of cyclin-dependent kinases by the CDK-activating kinase. J Biol Chem 270: 18195–18197, 1995 - PubMed
- Bell SE, Mavila A, Salazar R, Bayless KJ, Kanagala S, Maxwell SA, Davis GE. Differential gene expression during capillary morphogenesis in 3D collagen matrices: regulated expression of genes involved in basement membrane matrix assembly, cell cycle progression, cellular differentiation and G-protein signaling. J Cell Sci 114: 2755–2773, 2001 - PubMed
- Cai J, Jiang WG, Ahmed A, Boulton M. Vascular endothelial growth factor-induced endothelial cell proliferation is regulated by interaction between VEGFR-2, SH-PTP1 and eNOS. Microvasc Res 71: 20–31, 2006 - PubMed
- Carmeliet P, Jain RK. Angiogenesis in cancer and other diseases. Nature 407: 249–257, 2000 - PubMed
Publication types
MeSH terms
Substances
LinkOut - more resources
Full Text Sources
Molecular Biology Databases
Research Materials
Miscellaneous

