RNA interference screen in primary human T cells reveals FLT3 as a modulator of IL-10 levels - PubMed (original) (raw)
RNA interference screen in primary human T cells reveals FLT3 as a modulator of IL-10 levels
Anne L Astier et al. J Immunol. 2010.
Abstract
Functional studies of human primary immune cells have been hampered by the lack of tools to silence gene functions. In this study, we report the application of a lentiviral RNA interference library in primary human T cells. Using a subgenomic short hair RNA library targeting approximately 1000 signaling genes, we identified novel genes that control the levels of IL-10 produced. IL-10 is a potent anti-inflammatory cytokine secreted by several cell types, including T regulatory type 1 cells, a subset of T regulatory cells that exert their suppressive activity through IL-10 secretion. FLT3, a known hematopoeitic growth factor, was found to be a negative regulator of IL-10 levels in activated T cells. This was based on several observations. First, FLT3 and its ligand (FL) were both induced by T cell activation. Second, silencing of FLT3 led to increased IL-10 levels, whereas addition of FL suppressed IL-10 secretion and increased FLT3 surface levels. Third, engagement of CD46, a known inducer of T regulatory type 1 cells, upregulated surface FLT3, and secreted FL, which then inhibited IL-10 production by T cells. Hence, FL and FLT3 form a novel regulatory feedback loop that limits IL-10 production in T cells. Our results identified FLT3 as a new regulator of T cell function and offer a strategy to genetically dissect specific pathways in T cells.
Conflict of interest statement
Disclosure of Conflicts of Interest
The authors have no conflicts of interest.
Figures
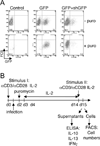
Figure 1. Infection of primary human T cells by GFP-lentivirus
(A) CD4+ primary human T cells were either not infected (control), infected by lentivirus encoding GFP (GFP) (LKO.3pgw) or co-infected by lentivirus encoding GFP and shGFP (GFP+shGFP). Twenty-four hours later, puromycin (2.5µg/ml) was added. Three days after infection, the percentage of infected cells (FL1+) was assessed by flow cytometry. (B) The optimized protocol used for the RNAi screen is depicted.
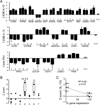
Figure 2. Summary of cytokine measurement across multiple RNAi experiments
(A) The mean of the Z scores obtained for the best constructs of the selected genes modulating IL-10, IL-13 and IFNγ in both primary and secondary screens, and other experiments for some genes, are plotted. The Z-score is defined as the difference between the value of a cytokine measurement in a particular well and the mean of the plate, divided by the standard deviation of the plate (i.e. how many standard deviations a particular measurement is from the mean). (B) Z-scores obtained for each individual shRNA construct targeting FLT3, across multiple independent experiments. (C) Correlation between the efficacy of knockdown and phenotype. The remaining gene expression of FLT3 after infection with the different hairpins was quantified by qRT-PCR. We determined the expression levels compared to T cells infected with controls hairpins, and calculated the percentage of remaining expression. This was plotted relative to the Z-score phenotype obtained for each construct.
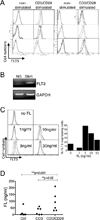
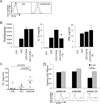
Figure 3. FLT3 expression in T cells and effect of FLT3 ligand (FL) on FLT3 expression
(A) FLT3 expression on human CD4+ T cells. Human CD4+ T cells were purified and stimulated by anti-CD3/CD28 antibodies in the presence of IL-2. Forty-eight hrs later, FLT3 expression was analyzed by flow cytometry using an anti-FLT3-PE or irrelevant IgG1-PE control antibody. Data shown was representative of 6 experiments. (B) T cells were activated as in (A), before analysis of FLT3 expression by RT-PCR. (C) FLT3-L (FL) modulates FLT3 expression at the cell surface. Human CD4+ T cells were stimulated by anti-CD3/CD28 antibodies in the presence of increasing doses of FL. FLT3 expression was assessed after 3 days of culture. The relative percentage of FLT3 expressing cells is also plotted. Representative of 4 experiments. (D) CD4+ T cells were left unstimulated (Ctrl), stimulated by anti-CD3 or anti-CD3/CD28 antibodies for 3 days. The concentrations of FL in the supernatants were then determined by ELISA.
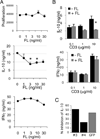
Figure 4. FLT3 ligand (FL) inhibits IL-10 production
(A) CD4+ T cells were stimulated by anti-CD3 (10 µg/ml) and anti-CD28 antibodies (5 µg/ml) in the presence of IL-2 with increasing concentrations of recombinant human FL. Three days later, the supernatants were collected to assess IL-10 and IFNγ production, and proliferation was determined by 3H-thymidine incorporation. Representative of 4 experiments. (B) IL-10 inhibition is dependent on the strength of TCR stimulation. T cells were activated with increasing doses of anti-CD3 as indicated, and anti-CD28 (2.5 ug/ml) in presence or absence of FL, and IL-10 and IFNγ secretion determined by ELISA. (C) IL-10 inhibition by FL in activated T cells is dependent on the presence of FLT3 expression. T cells were infected with shFLT3-3 (non-silencing) and shFLT3-4 (silencing) prior to stimulation in activated T cells (as in A) in the presence of FL. IL-10 secretion was measured by ELISA, and shown relative to T cells without FL treatment.
Figure 5. Tr1 cells express FLT3, secrete FL, and FL inhibits their IL-10 production
(A) CD4+ T cells were differentiated into Tr1 cells by stimulation with anti-CD3/CD46 antibodies in the presence of IL-2. Three days later, FLT3 expression was assessed by flow cytometry using an anti-FLT3-PE or irrelevant IgG1-PE control antibody. (B) CD4+ T cells were left unstimulated (Ctrl), stimulated by anti-CD3 antibodies or differentiated into Tr1 cells by stimulation with anti-CD3/CD46 antibodies in presence of IL-2 (Tr1) for 3 days, in presence or absence of FL. The production of IFNγ and IL-10 by CD46-induced Tr1 cells was then quantified by ELISA. Representative of 4 experiments (C) The concentrations of FL in the supernatants of activated T cells (as indicated) were determined by ELISA. (D) CD4+ primary human T cells were first stimulated with anti-CD3/CD46 antibodies in the presence of IL-2 for 24 hrs before infection by lentivirus encoding the two best shRNA targeting FLT3 (#4 and #6), or shRNA-GFP as a control (FACS plots shown). Twenty-four hours later, the supernatants were harvested and the levels of IL-10 and IFNγ determined by ELISA.
Figure 6. Proposed model of the regulation of IL-10 secretion by the FLT3-FL regulatory feedback loop
Activated T cells or CD46-differentiated Tr1 cells produce IL-10, while they also upregulate FLT3 at their cell surface and produce soluble FL. The activation of FLT3 results then in a downregulation of IL-10 production.
Similar articles
- Expression of FLT3 receptor and response to FLT3 ligand by leukemic cells.
Drexler HG. Drexler HG. Leukemia. 1996 Apr;10(4):588-99. Leukemia. 1996. PMID: 8618433 Review. - Cell-surface trafficking and release of flt3 ligand from T lymphocytes is induced by common cytokine receptor gamma-chain signaling and inhibited by cyclosporin A.
Chklovskaia E, Nissen C, Landmann L, Rahner C, Pfister O, Wodnar-Filipowicz A. Chklovskaia E, et al. Blood. 2001 Feb 15;97(4):1027-34. doi: 10.1182/blood.v97.4.1027. Blood. 2001. PMID: 11159533 - Effect of small interfering RNA targeting wild-type FLT3 in acute myeloid leukaemia cells in vitro and in vivo.
Wang CM, Sheng GY, Lu J, Xie L, Bai ST, Xu XJ, Liu YF. Wang CM, et al. J Int Med Res. 2011;39(5):1661-74. doi: 10.1177/147323001103900508. J Int Med Res. 2011. PMID: 22117966 - Effects of FLT3 ligand on proliferation and survival of myeloid leukemia cells.
Drexler HG, Meyer C, Quentmeier H. Drexler HG, et al. Leuk Lymphoma. 1999 Mar;33(1-2):83-91. doi: 10.3109/10428199909093728. Leuk Lymphoma. 1999. PMID: 10194124 Review.
Cited by
- Altered AKT1 and MAPK1 gene expression on peripheral blood mononuclear cells and correlation with T-helper-transcription factors in systemic lupus erythematosus patients.
Garcia-Rodriguez S, Callejas-Rubio JL, Ortego-Centeno N, Zumaquero E, Ríos-Fernandez R, Arias-Santiago S, Navarro P, Sancho J, Zubiaur M. Garcia-Rodriguez S, et al. Mediators Inflamm. 2012;2012:495934. doi: 10.1155/2012/495934. Epub 2012 Oct 18. Mediators Inflamm. 2012. PMID: 23125486 Free PMC article. - The Cytokine Flt3-Ligand in Normal and Malignant Hematopoiesis.
Tsapogas P, Mooney CJ, Brown G, Rolink A. Tsapogas P, et al. Int J Mol Sci. 2017 May 24;18(6):1115. doi: 10.3390/ijms18061115. Int J Mol Sci. 2017. PMID: 28538663 Free PMC article. Review. - IL-6 receptor blockade corrects defects of XIAP-deficient regulatory T cells.
Hsieh WC, Hsu TS, Chang YJ, Lai MZ. Hsieh WC, et al. Nat Commun. 2018 Jan 31;9(1):463. doi: 10.1038/s41467-018-02862-4. Nat Commun. 2018. PMID: 29386580 Free PMC article. - Decreased RORC-dependent silencing of prostaglandin receptor EP2 induces autoimmune Th17 cells.
Kofler DM, Marson A, Dominguez-Villar M, Xiao S, Kuchroo VK, Hafler DA. Kofler DM, et al. J Clin Invest. 2014 Jun;124(6):2513-22. doi: 10.1172/JCI72973. Epub 2014 May 8. J Clin Invest. 2014. PMID: 24812667 Free PMC article. - Using functional genomics to overcome therapeutic resistance in hematological malignancies.
Alvarez-Calderon F, Gregory MA, DeGregori J. Alvarez-Calderon F, et al. Immunol Res. 2013 Mar;55(1-3):100-15. doi: 10.1007/s12026-012-8353-z. Immunol Res. 2013. PMID: 22941562 Free PMC article. Review.
References
- Vieira P, de Waal-Malefyt R, Dang MN, Johnson KE, Kastelein R, Fiorentino DF, deVries JE, Roncarolo MG, Mosmann TR, Moore KW. Isolation and expression of human cytokine synthesis inhibitory factor cDNA clones: homology to Epstein-Barr virus open reading frame BCRFI. Proc Natl Acad Sci U S A. 1991;88:1172–1176. - PMC - PubMed
- Groux H, O'Garra A, Bigler M, Rouleau M, Antonenko S, de Vries JE, Roncarolo MG. A CD4+ T-cell subset inhibits antigen-specific T-cell responses and prevents colitis. Nature. 1997;389:737–742. - PubMed
- Kuhn R, Lohler J, Rennick D, Rajewsky K, Muller W. Interleukin-10-deficient mice develop chronic enterocolitis. Cell. 1993;75:263–274. - PubMed
- Battaglia M, Stabilini A, Draghici E, Migliavacca B, Gregori S, Bonifacio E, Roncarolo MG. Induction of Tolerance in Type 1 Diabetes via Both CD4+CD25+ T Regulatory Cells and T Regulatory Type 1 Cells. Diabetes. 2006;55:1571–1580. - PubMed
- Pennline KJ, Roque-Gaffney E, Monahan M. Recombinant human IL-10 prevents the onset of diabetes in the nonobese diabetic mouse. Clin Immunol Immunopathol. 1994;71:169–175. - PubMed
Publication types
MeSH terms
Substances
Grants and funding
- DP2 OD002230-01/OD/NIH HHS/United States
- U19 AI070352-01/AI/NIAID NIH HHS/United States
- U19 AI070352/AI/NIAID NIH HHS/United States
- NS24247/NS/NINDS NIH HHS/United States
- R37 NS024247/NS/NINDS NIH HHS/United States
- 859/MSS_/Multiple Sclerosis Society/United Kingdom
- P01 AI039671/AI/NIAID NIH HHS/United States
- DP2 OD002230/OD/NIH HHS/United States
- P01 AI045757/AI/NIAID NIH HHS/United States
- U19 AI046130/AI/NIAID NIH HHS/United States
- G0801924/MRC_/Medical Research Council/United Kingdom
- R21 AI071060/AI/NIAID NIH HHS/United States
- R01 NS024247/NS/NINDS NIH HHS/United States
LinkOut - more resources
Full Text Sources
Other Literature Sources
Miscellaneous
