Ligand-specific regulation of the extracellular surface of a G-protein-coupled receptor - PubMed (original) (raw)
. 2010 Jan 7;463(7277):108-12.
doi: 10.1038/nature08650.
Yaozhong Zou, Søren G F Rasmussen, Corey W Liu, Rie Nygaard, Daniel M Rosenbaum, Juan José Fung, Hee-Jung Choi, Foon Sun Thian, Tong Sun Kobilka, Joseph D Puglisi, William I Weis, Leonardo Pardo, R Scott Prosser, Luciano Mueller, Brian K Kobilka
Affiliations
- PMID: 20054398
- PMCID: PMC2805469
- DOI: 10.1038/nature08650
Ligand-specific regulation of the extracellular surface of a G-protein-coupled receptor
Michael P Bokoch et al. Nature. 2010.
Abstract
G-protein-coupled receptors (GPCRs) are seven-transmembrane proteins that mediate most cellular responses to hormones and neurotransmitters. They are the largest group of therapeutic targets for a broad spectrum of diseases. Recent crystal structures of GPCRs have revealed structural conservation extending from the orthosteric ligand-binding site in the transmembrane core to the cytoplasmic G-protein-coupling domains. In contrast, the extracellular surface (ECS) of GPCRs is remarkably diverse and is therefore an ideal target for the discovery of subtype-selective drugs. However, little is known about the functional role of the ECS in receptor activation, or about conformational coupling of this surface to the native ligand-binding pocket. Here we use NMR spectroscopy to investigate ligand-specific conformational changes around a central structural feature in the ECS of the beta(2) adrenergic receptor: a salt bridge linking extracellular loops 2 and 3. Small-molecule drugs that bind within the transmembrane core and exhibit different efficacies towards G-protein activation (agonist, neutral antagonist and inverse agonist) also stabilize distinct conformations of the ECS. We thereby demonstrate conformational coupling between the ECS and the orthosteric binding site, showing that drugs targeting this diverse surface could function as allosteric modulators with high subtype selectivity. Moreover, these studies provide a new insight into the dynamic behaviour of GPCRs not addressable by static, inactive-state crystal structures.
Figures
Figure 1. Extracellular domains of carazolol-bound β2AR (PDB: 2RH1)
a, The extracellular surface (ECS) of β2AR showing extracellular loop 2 (ECL2, cyan, Met171-Ala198), extracellular loop 3 (ECL3, dark blue, His296-Glu306), Lys3057.32 (magenta), Asp192 (yellow), and inverse agonist carazolol (green). ECL1 (Met96-Phe108) is part of the ECS but is not colored. b, Intramolecular and ligand binding interactions. Spheres indicate the alpha carbons of residues in direct contact with carazolol (at least one atom within 4 Å distance). Disulfide bonds are shown as yellow sticks. Other colors are the same as in a. Transmembrane helices 1 and 2 removed for clarity. D192 and K305 form the only lysine salt bridge observed in the crystal structure. The solvent accessibility of D192 and K305 was calculated with the NACCESS program (Hubbard & Thornton). The relative accessibilities of D192 and K305 are 35% and 75%, respectively, compared to the accessibility of that residue type in an extended Ala-x-Ala tripeptide.
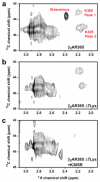
Figure 2. Dimethyllysine NMR spectroscopy of [13C]methyl-β2AR and assignment of Lys305
a, Dimethylamine region of STD-filtered HC-HMQC spectrum of carazolol-bound β2AR365, containing 14 Lys and amino terminal FLAG-TEV sequence (Supplementary Fig. 2). b, Spectrum of β2AR365 with seven cytoplasmic Lys to Arg mutations (β2AR365 Δ7Lys) and the amino terminus removed by TEV proteolysis. c, Spectrum of β2AR365 Δ7Lys plus the Lys305Arg mutation and the amino terminus removed by TEV proteolysis.
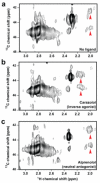
Figure 3. Effect of inverse agonist and antagonist on the [13C]dimethyl-Lys305 NMR resonances
HSQC spectra of a, unliganded β2AR (≈60 μM), b, β2AR bound to inverse agonist carazolol and c, β2AR bound to neutral antagonist alprenolol.
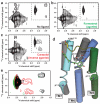
Figure 4. Activation of β2AR by formoterol
STD-filtered HMQC spectra of a, unliganded β2AR (≈60 μM), b, the same sample bound to a saturating concentration (320 μM) of agonist (R,R)-formoterol, and c, the same sample after exchanging formoterol for inverse agonist carazolol by dialysis. d, Model of β2AR activation by formoterol (see Supplementary Fig. 16). Colored helices, loops, and side chains represent the carazolol-bound crystal structure (PDB: 2RH1). Gray helices and white side chains indicate the active state model. Green sticks indicate (R,R)-formoterol and yellow indicates ECL2. e, Overlay of spectra corresponding to dashed regions shown in panels a-c. The spectrum of unliganded β2AR from panel a is shown in black, agonist-bound β2AR from panel b in green, and inverse agonist-bound β2AR from panel c in red.
Similar articles
- Mechanism of intracellular allosteric β2AR antagonist revealed by X-ray crystal structure.
Liu X, Ahn S, Kahsai AW, Meng KC, Latorraca NR, Pani B, Venkatakrishnan AJ, Masoudi A, Weis WI, Dror RO, Chen X, Lefkowitz RJ, Kobilka BK. Liu X, et al. Nature. 2017 Aug 24;548(7668):480-484. doi: 10.1038/nature23652. Epub 2017 Aug 16. Nature. 2017. PMID: 28813418 Free PMC article. - Allosteric nanobodies reveal the dynamic range and diverse mechanisms of G-protein-coupled receptor activation.
Staus DP, Strachan RT, Manglik A, Pani B, Kahsai AW, Kim TH, Wingler LM, Ahn S, Chatterjee A, Masoudi A, Kruse AC, Pardon E, Steyaert J, Weis WI, Prosser RS, Kobilka BK, Costa T, Lefkowitz RJ. Staus DP, et al. Nature. 2016 Jul 21;535(7612):448-52. doi: 10.1038/nature18636. Epub 2016 Jul 13. Nature. 2016. PMID: 27409812 Free PMC article. - Allosteric coupling from G protein to the agonist-binding pocket in GPCRs.
DeVree BT, Mahoney JP, Vélez-Ruiz GA, Rasmussen SG, Kuszak AJ, Edwald E, Fung JJ, Manglik A, Masureel M, Du Y, Matt RA, Pardon E, Steyaert J, Kobilka BK, Sunahara RK. DeVree BT, et al. Nature. 2016 Jul 7;535(7610):182-6. doi: 10.1038/nature18324. Epub 2016 Jun 29. Nature. 2016. PMID: 27362234 Free PMC article. - Structural features of β2 adrenergic receptor: crystal structures and beyond.
Bang I, Choi HJ. Bang I, et al. Mol Cells. 2015;38(2):105-11. doi: 10.14348/molcells.2015.2301. Epub 2014 Dec 24. Mol Cells. 2015. PMID: 25537861 Free PMC article. Review. - Advances in receptor conformation research: the quest for functionally selective conformations focusing on the β2-adrenoceptor.
Woo AY, Song Y, Zhu W, Xiao RP. Woo AY, et al. Br J Pharmacol. 2015 Dec;172(23):5477-88. doi: 10.1111/bph.13049. Epub 2015 Feb 27. Br J Pharmacol. 2015. PMID: 25537131 Free PMC article. Review.
Cited by
- β2-Adrenergic receptor solutions for structural biology analyzed with microscale NMR diffusion measurements.
Horst R, Stanczak P, Stevens RC, Wüthrich K. Horst R, et al. Angew Chem Int Ed Engl. 2013 Jan 2;52(1):331-5. doi: 10.1002/anie.201205474. Epub 2012 Oct 24. Angew Chem Int Ed Engl. 2013. PMID: 23097212 Free PMC article. - G-protein coupled receptor 83 (GPR83) signaling determined by constitutive and zinc(II)-induced activity.
Müller A, Kleinau G, Piechowski CL, Müller TD, Finan B, Pratzka J, Grüters A, Krude H, Tschöp M, Biebermann H. Müller A, et al. PLoS One. 2013;8(1):e53347. doi: 10.1371/journal.pone.0053347. Epub 2013 Jan 15. PLoS One. 2013. PMID: 23335960 Free PMC article. - Ligand-specific interactions modulate kinetic, energetic, and mechanical properties of the human β2 adrenergic receptor.
Zocher M, Fung JJ, Kobilka BK, Müller DJ. Zocher M, et al. Structure. 2012 Aug 8;20(8):1391-402. doi: 10.1016/j.str.2012.05.010. Epub 2012 Jun 28. Structure. 2012. PMID: 22748765 Free PMC article. - Long range effect of mutations on specific conformational changes in the extracellular loop 2 of angiotensin II type 1 receptor.
Unal H, Jagannathan R, Bhatnagar A, Tirupula K, Desnoyer R, Karnik SS. Unal H, et al. J Biol Chem. 2013 Jan 4;288(1):540-51. doi: 10.1074/jbc.M112.392514. Epub 2012 Nov 8. J Biol Chem. 2013. PMID: 23139413 Free PMC article. - Methyl-Induced Polarization Destabilizes the Noncovalent Interactions of N-Methylated Lysines.
Rahman S, Wineman-Fisher V, Nagy PR, Al-Hamdani Y, Tkatchenko A, Varma S. Rahman S, et al. Chemistry. 2021 Jul 26;27(42):11005-11014. doi: 10.1002/chem.202100644. Epub 2021 Jun 17. Chemistry. 2021. PMID: 33999467 Free PMC article.
References
- Rosenbaum DM, et al. GPCR engineering yields high-resolution structural insights into beta2-adrenergic receptor function. Science. 2007;318:1266–73. - PubMed
- Rasmussen SG, et al. Crystal structure of the human beta2 adrenergic G-protein-coupled receptor. Nature. 2007;450:383–7. - PubMed
Publication types
MeSH terms
Substances
Grants and funding
- R21 MH082313/MH/NIMH NIH HHS/United States
- R21 MH082313-01A1/MH/NIMH NIH HHS/United States
- R37 NS028471-19/NS/NINDS NIH HHS/United States
- R01 GM056169-13/GM/NIGMS NIH HHS/United States
- R01 NS028471/NS/NINDS NIH HHS/United States
- GM56169/GM/NIGMS NIH HHS/United States
- NS028471/NS/NINDS NIH HHS/United States
- R01 GM056169/GM/NIGMS NIH HHS/United States
- R37 NS028471/NS/NINDS NIH HHS/United States
LinkOut - more resources
Full Text Sources
Other Literature Sources
Molecular Biology Databases


