SRT1720, SRT2183, SRT1460, and resveratrol are not direct activators of SIRT1 - PubMed (original) (raw)
. 2010 Mar 12;285(11):8340-51.
doi: 10.1074/jbc.M109.088682. Epub 2010 Jan 8.
John E Bleasdale, Boris Chrunyk, David Cunningham, Declan Flynn, Robert S Garofalo, David Griffith, Matt Griffor, Pat Loulakis, Brandon Pabst, Xiayang Qiu, Brian Stockman, Venkataraman Thanabal, Alison Varghese, Jessica Ward, Jane Withka, Kay Ahn
Affiliations
- PMID: 20061378
- PMCID: PMC2832984
- DOI: 10.1074/jbc.M109.088682
SRT1720, SRT2183, SRT1460, and resveratrol are not direct activators of SIRT1
Michelle Pacholec et al. J Biol Chem. 2010.
Abstract
Sirtuins catalyze NAD(+)-dependent protein deacetylation and are critical regulators of transcription, apoptosis, metabolism, and aging. There are seven human sirtuins (SIRT1-7), and SIRT1 has been implicated as a key mediator of the pathways downstream of calorie restriction that have been shown to delay the onset and reduce the incidence of age-related diseases such as type 2 diabetes. Increasing SIRT1 activity, either by transgenic overexpression of the Sirt1 gene in mice or by pharmacological activation by small molecule activators resveratrol and SRT1720, has shown beneficial effects in rodent models of type 2 diabetes, indicating that SIRT1 may represent an attractive therapeutic target. Herein, we have assessed purported SIRT1 activators by employing biochemical assays utilizing native substrates, including a p53-derived peptide substrate lacking a fluorophore as well as the purified native full-length protein substrates p53 and acetyl-CoA synthetase1. SRT1720, its structurally related compounds SRT2183 and SRT1460, and resveratrol do not lead to apparent activation of SIRT1 with native peptide or full-length protein substrates, whereas they do activate SIRT1 with peptide substrate containing a covalently attached fluorophore. Employing NMR, surface plasmon resonance, and isothermal calorimetry techniques, we provide evidence that these compounds directly interact with fluorophore-containing peptide substrates. Furthermore, we demonstrate that SRT1720 neither lowers plasma glucose nor improves mitochondrial capacity in mice fed a high fat diet. SRT1720, SRT2183, SRT1460, and resveratrol exhibit multiple off-target activities against receptors, enzymes, transporters, and ion channels. Taken together, we conclude that SRT1720, SRT2183, SRT1460, and resveratrol are not direct activators of SIRT1.
Figures
FIGURE 1.
Structures of putative SIRT1 activators, SRT1720, SRT2183, SRT1460, and resveratrol.
FIGURE 2.
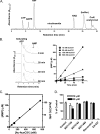
Effects of SRT1720, SRT2183, SRT1460, and resveratrol on SIRT1 deacetylating activity with TAMRA-p53 peptide substrate (TAMRA Peptide 1 in supplemental Table S1) determined by HPLC. A, time course of SIRT1 reaction showing an increase in the deacetylated peptide product and a decrease in the acetylated peptide substrate. SIRT1 reactions were carried out with 10 nm SIRT1 under the conditions described under “Experimental Procedures.” B, time course of SIRT1 reactions at 2.5, 5, and 10 nm SIRT1 is shown as the percentage of conversion of TAMRA-p53 peptide substrate versus time. C, dose-response curves of SIRT1 activation by the Sirtris series and resveratrol. Error bars in B and C indicate S.D.
FIGURE 3.
Effects of SRT1720, SRT2183, SRT1460, and resveratrol on SIRT1 deacetylating activity with native p53 peptide substrate (Native Peptide 3 in supplemental Table S1) determined by HPLC. A, time course of SIRT1 reaction showing an increase in the deacetylated peptide product and a decrease in the acetylated peptide substrate. SIRT1 reactions were carried out with 5 nm SIRT1 under the conditions described under “Experimental Procedures.” B, time course of SIRT1 reactions shown as the percentage of conversion of native peptide substrate versus time. C, effects of the indicated compounds on SIRT1 activity. Error bars in B and C indicate S.D.
SCHEME 1.
FIGURE 4.
Effects of SRT1720, SRT2183, SRT1460, and resveratrol on SIRT1 deacetylating activity with purified native full-length Ac-p53 substrate. After the SIRT1 reactions, the remaining Ac-p53 and total p53 were quantified by ELISA or Western blot analysis as described under “Experimental Procedures.” A, SIRT1 activity is linear with increasing concentrations of Ac-p53 at up to 850 n
m
, demonstrating that the Km value for Ac-p53 is greater than 850 n
m
. RLU, relative luminescent units. B, effects of the indicated compounds at 30 μ
m
on SIRT1 activity. The levels of Ac-p53 and total p53 were quantified by ELISA. C, deacetylation of Ac-p53 increases with increasing concentrations of SIRT1, whereas the total p53 quantity is unaffected. D, effects of the indicated compounds at 30 μ
m
on SIRT1 activity with Ac-p53 substrate by Western blot. The levels of Ac-p53 were corrected for total p53 loaded onto each lane. Error bars in B and D indicate S.D.
FIGURE 5.
SIRT1 reaction with full-length Ac-AceCS1 substrate. SIRT1 reactions were monitored by measuring AceCS1 activity as described under “Experimental Procedures.” A, separation of the components for the SIRT1 and AceCS1 reactions (1 nmol of ATP, ADPR, AMP, nicotinamide, NAD, CoA, and acetyl-CoA each) by HPLC. Low extinction coefficient of nicotinamide results in lower relative peak area, although quantification of nicotinamide was accomplished at higher concentrations with high reproducibility. B, time course of AceCS1 reactions carried out under the conditions described under “Experimental Procedures” at AceCS1 concentrations of 10–500 n
m
. The HPLC chromatogram is shown for 150 n
m
AceCS1. C, SIRT1 activity is linear with increasing concentrations of Ac-AceCS1 at up to 750 n
m
, demonstrating that the Km value for Ac-AceCS1 is greater than 750 n
m
. D, effects of SRT1720, SRT2183, SRT1460, and resveratrol on SIRT1 activity with Ac-AceCS1 substrate. Error bars in C and D indicate S.D.
FIGURE 6.
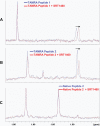
NMR chemical shift perturbation studies of SRT1460 with p53-derived peptide substrates in the absence of SIRT1. A, 1H NMR spectrum of 10 μ
m
of the TAMRA Peptide 1 (
supplemental Table S1
) in the presence (red) or absence (blue) of 50 μ
m
SRT1460. B, 1H NMR spectrum of 10 μ
m
of TAMRA Peptide 2 in the presence (red) or absence (blue) of 50 μ
m
SRT1460. C, 1H NMR spectrum of 10 μ
m
of the Native Peptide 2 in the presence (red) or absence (blue) of 50 μ
m
SRT1460. Arrows indicate the upfield shift of the acetyl (CH3) signal at 1.78 ppm in A and B (blue) upon the addition of 50 μ
m
SRT1460 (red), whereas the acetyl (CH3) signal at 1.83 ppm in C showed no shift (blue and red) upon the addition of 50 μ
m
SRT1460. The amino acid sequence of the TAMRA Peptide 2 and the Native Peptide 2 are identical and differ only in the TAMRA group (
supplemental Table S1
).
FIGURE 7.
ITC titrations of SIRT1 peptide substrate complexes with SRT1460. Top panels, binding isotherm for titrations of SRT1460 to the SIRT1-TAMRA Peptide 1 complex (A) and the SIRT1-Native Peptide 3 complex (B). Bottom panels, integrated fit with a one-site binding model. The amino acid sequence of the TAMRA Peptide 1 and the Native Peptide 3 are shown in
supplemental Table S1
.
FIGURE 8.
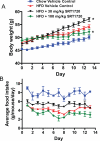
Effect of chronic dosing of SRT1720 on (A) body weight and (B) food intake in ob/ob mice fed a high fat diet. ob/ob mice were placed on a HFD (60% calories from fat) for 1 week before being dosed with SRT1720 at the indicated doses once daily by oral gavage. Food intake per cage and individual body weights were recorded daily over 13 days of treatment. The graph represents mean ± S.E. for all groups (n = 8 for chow and HFD control groups and SRT1720 at 30 mg/kg groups; SRT1720 at 100 mg/kg group had n = 8 on day 1, which had dropped to n = 5 by day 13). *, p < 0.05 when compared with HFD control by two-way ANOVA and Student's t test.
FIGURE 9.
Selectivity profiles of SRT1720, SRT2183, SRT1460, and resveratrol. All four compounds were tested at 10 μ
m
against over 100 targets listed in
supplemental Table 1
. A range of 0–100% inhibition is shown in a colored scale.
Similar articles
- Small molecule activators of SIRT1 replicate signaling pathways triggered by calorie restriction in vivo.
Smith JJ, Kenney RD, Gagne DJ, Frushour BP, Ladd W, Galonek HL, Israelian K, Song J, Razvadauskaite G, Lynch AV, Carney DP, Johnson RJ, Lavu S, Iffland A, Elliott PJ, Lambert PD, Elliston KO, Jirousek MR, Milne JC, Boss O. Smith JJ, et al. BMC Syst Biol. 2009 Mar 10;3:31. doi: 10.1186/1752-0509-3-31. BMC Syst Biol. 2009. PMID: 19284563 Free PMC article. - Small molecule activators of SIRT1 as therapeutics for the treatment of type 2 diabetes.
Milne JC, Lambert PD, Schenk S, Carney DP, Smith JJ, Gagne DJ, Jin L, Boss O, Perni RB, Vu CB, Bemis JE, Xie R, Disch JS, Ng PY, Nunes JJ, Lynch AV, Yang H, Galonek H, Israelian K, Choy W, Iffland A, Lavu S, Medvedik O, Sinclair DA, Olefsky JM, Jirousek MR, Elliott PJ, Westphal CH. Milne JC, et al. Nature. 2007 Nov 29;450(7170):712-6. doi: 10.1038/nature06261. Nature. 2007. PMID: 18046409 Free PMC article. - SIRT1-independent mechanisms of the putative sirtuin enzyme activators SRT1720 and SRT2183.
Huber JL, McBurney MW, Distefano PS, McDonagh T. Huber JL, et al. Future Med Chem. 2010 Dec;2(12):1751-9. doi: 10.4155/fmc.10.257. Future Med Chem. 2010. PMID: 21428798 - Biochemical effects of SIRT1 activators.
Baur JA. Baur JA. Biochim Biophys Acta. 2010 Aug;1804(8):1626-34. doi: 10.1016/j.bbapap.2009.10.025. Epub 2009 Nov 6. Biochim Biophys Acta. 2010. PMID: 19897059 Free PMC article. Review. - Are sirtuins viable targets for improving healthspan and lifespan?
Baur JA, Ungvari Z, Minor RK, Le Couteur DG, de Cabo R. Baur JA, et al. Nat Rev Drug Discov. 2012 Jun 1;11(6):443-61. doi: 10.1038/nrd3738. Nat Rev Drug Discov. 2012. PMID: 22653216 Free PMC article. Review.
Cited by
- Pro-autophagic polyphenols reduce the acetylation of cytoplasmic proteins.
Pietrocola F, Mariño G, Lissa D, Vacchelli E, Malik SA, Niso-Santano M, Zamzami N, Galluzzi L, Maiuri MC, Kroemer G. Pietrocola F, et al. Cell Cycle. 2012 Oct 15;11(20):3851-60. doi: 10.4161/cc.22027. Cell Cycle. 2012. PMID: 23070521 Free PMC article. - Sirtuins, aging, and cardiovascular risks.
Favero G, Franceschetti L, Rodella LF, Rezzani R. Favero G, et al. Age (Dordr). 2015 Aug;37(4):9804. doi: 10.1007/s11357-015-9804-y. Epub 2015 Jun 23. Age (Dordr). 2015. PMID: 26099749 Free PMC article. Review. - Structural basis for sirtuin activity and inhibition.
Yuan H, Marmorstein R. Yuan H, et al. J Biol Chem. 2012 Dec 14;287(51):42428-35. doi: 10.1074/jbc.R112.372300. Epub 2012 Oct 18. J Biol Chem. 2012. PMID: 23086949 Free PMC article. Review. - A fluorogenic assay for screening Sirt6 modulators.
Hu J, He B, Bhargava S, Lin H. Hu J, et al. Org Biomol Chem. 2013 Aug 28;11(32):5213-6. doi: 10.1039/c3ob41138a. Org Biomol Chem. 2013. PMID: 23839075 Free PMC article. - Sirtuin functions and modulation: from chemistry to the clinic.
Carafa V, Rotili D, Forgione M, Cuomo F, Serretiello E, Hailu GS, Jarho E, Lahtela-Kakkonen M, Mai A, Altucci L. Carafa V, et al. Clin Epigenetics. 2016 May 25;8:61. doi: 10.1186/s13148-016-0224-3. eCollection 2016. Clin Epigenetics. 2016. PMID: 27226812 Free PMC article. Review.
References
- Moynihan K. A., Grimm A. A., Plueger M. M., Bernal-Mizrachi E., Ford E., Cras-Méneur C., Permutt M. A., Imai S. (2005) Cell Metab. 2, 105–117 - PubMed
- Starai V. J., Celic I., Cole R. N., Boeke J. D., Escalante-Semerena J. C. (2002) Science 298, 2390–2392 - PubMed
- Liang F., Kume S., Koya D. (2009) Nat. Rev. Endocrinol. 5, 367–373 - PubMed
- Sauve A. A., Wolberger C., Schramm V. L., Boeke J. D. (2006) Annu. Rev. Biochem. 75, 435–465 - PubMed
MeSH terms
Substances
LinkOut - more resources
Full Text Sources
Other Literature Sources
Medical
Research Materials
Miscellaneous


