Control of ATP homeostasis during the respiro-fermentative transition in yeast - PubMed (original) (raw)
Control of ATP homeostasis during the respiro-fermentative transition in yeast
Thomas Walther et al. Mol Syst Biol. 2010.
Abstract
Respiring Saccharomyces cerevisiae cells respond to a sudden increase in glucose concentration by a pronounced drop of their adenine nucleotide content ([ATP]+[ADP]+[AMP]=[AXP]). The unknown fate of 'lost' AXP nucleotides represented a long-standing problem for the understanding of the yeast's physiological response to changing growth conditions. Transient accumulation of the purine salvage pathway intermediate, inosine, accounted for the apparent loss of adenine nucleotides. Conversion of AXPs into inosine was facilitated by AMP deaminase, Amd1, and IMP-specific 5'-nucleotidase, Isn1. Inosine recycling into the AXP pool was facilitated by purine nucleoside phosphorylase, Pnp1, and joint action of the phosphoribosyltransferases, Hpt1 and Xpt1. Analysis of changes in 24 intracellular metabolite pools during the respiro-fermentative growth transition in wild-type, amd1, isn1, and pnp1 strains revealed that only the amd1 mutant exhibited significant deviations from the wild-type behavior. Moreover, mutants that were blocked in inosine production exhibited delayed growth acceleration after glucose addition. It is proposed that interconversion of adenine nucleotides and inosine facilitates rapid and energy-cost efficient adaptation of the AXP pool size to changing environmental conditions.
Conflict of interest statement
The authors declare that they have no conflict of interest.
Figures
Figure 1
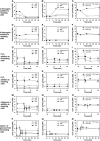
Intracellular concentrations of glycolytic, TCA cycle, and pentose phosphate pathway metabolites after exposure of trehalose-grown wild-type cells to sudden increase of glucose concentration to 110 mmol/l. (A) ATP, ADP, and AMP; (B) GTP, GDP, and GMP; (C) sum of adenine and guanine nucleotides; (D) energy charge, inorganic phosphate (Pi); (E) glycerol-3-phosphate (G3P); trehalose-6-phosphate (T6P); (F) glucose-6-phosphate (G6P); glucose-1-phosphate (G1P); (G) malate; (H) ribose-5-phosphate (R5P); ribose-1-phosphate (R1P); (I) fructose-6-phosphate (F6P); fructose-1,6-bisphosphate (F1,6P); (J) 6-phosphogluconate (6PG); phosphoribosyl pyrophosphate (PRPP); (K) alpha-ketoglutarate (alphaKG); (L) phosphoenolpyruvate (PEP); pooled 2 and 3-phosphoglycerate (2/3PG); 1,3-phosphodiglycerate (1,3diPG). Data shown represent the average of at least two independent experiments. Metabolite concentrations are provided in tabular form in Supplementary information II.
Figure 2
Intracellular concentrations of adenine nucleotides and selected purine salvage pathway metabolites after exposure of trehalose-grown wild-type cells to sudden increase of glucose concentration to 110 mmol/l. (A) ATP, ADP, and AMP; (B) hypoxanthine, inosine, IMP; (C) sum of AXP nucleotides, sum of (AXP+IMP+inosine+hypoxanthine). Data represent the average of at least two independent experiments.
Figure 3
Intracellular concentrations of adenine nucleotides and selected purine salvage pathway metabolites in response to addition of sugar derivatives and different perturbations of energy homeostasis under fermentative and respiratory conditions. Addition of (A–C) 6-deoxyglucose, (D–F) 2-deoxyglucose (each at a final concentration of 110 mmol/l) to trehalose-grown cells. Addition of H2O2 (final concentration 2 mM) to (G–I) glucose-grown or (J–L) trehalose-grown cells. (M–O) Addition of antimycin A (final concentration 2 μg/ml) to trehalose-grown cells. (P–R) Transfer of glucose-grown cells to medium containing 110 mmol/l trehalose as the only carbon source. Cells were cultivated on glucose until mid-exponential phase, spun down by centrifugation, and resuspended in trehalose medium having the same composition except for the carbon source. (Cells that were resuspended in glucose medium as a control did not exhibit any change in AXP concentration; data not shown.) All experiments were carried out using wild-type cells. Left panel of figures: ATP, ADP, and AMP. Middle panel of figures: hypoxanthine, inosine, and IMP. Right panel of figures: Sum of AXP nucleotides, sum of (AXP+IMP+inosine+hypoxanthine). Data represent the average of at least two independent experiments.
Figure 4
Schematic representation of purine salvage pathway reactions. Metabolites are depicted in black and enzymes in blue. Dashed lines with question marks indicate reactions that exist according to the KEGG database but which were not yet identified in Saccharomyces cerevisiae. (Metabolites: AdeS, adenylosuccinate; Asp, aspartate; Fum, fumarate; PRPP, phosphoribosyl pyrophosphate; PPi, pyrophosphate; Pi, phosphate. Enzymes: Aah1, adenine deaminase; Ade5,7, aminoimidazole ribotide synthetase and glycinamide ribotide synthetase; Ade13, adenylosuccinate lyase; Ade12, adenylosuccinate synthase; Adk1, adenylate kinase; Ado1, adenosine kinase; Amd1, AMP deaminase; Apt1, adenine phosphoribosyltransferase; Gua1, GMP synthase; Gud1, guanine deaminase; Guk1, guanylate kinase; Hpt1, hypoxanthine–guanine phosphoribosyltransferase; Imd2,3,4, IMP dehydrogenase; Isn1, IMP-specific 5′-nucleotidase; Pnp1, purine nucleoside phosphorylase; Xpt1, xanthine–guanine phosphoribosyltransferase; Ynk1, nucleoside diphosphate kinase; adapted from Lecoq et al (2001a), the KEGG database (Kanehisa et al, 2008), and personal communication from Drs B Daignan-Fornier and B Pinson.
Figure 5
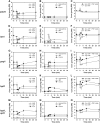
Intracellular concentrations of adenine nucleotides and selected purine salvage pathway metabolites after exposure of trehalose-grown purine salvage pathway mutants to sudden increase of glucose concentration to 110 mmol/l. Data corresponding to each mutant are arranged row wise. Left panel of figures: ATP, ADP, and AMP. Middle panel of figures: hypoxanthine, inosine, and IMP. Right panel of figures: Sum of AXP nucleotides, sum of (AXP+IMP+inosine+hypoxanthine). Data represent the average of at least two independent experiments. Metabolite concentrations are provided in tabular form in Supplementary information I.
Figure 5
Continued.
Figure 6
Intracellular metabolite concentrations in trehalose-grown wild-type, amd1, isn1, and pnp1 mutant strains after a sudden increase in glucose concentration to 110 mmol/l in the presence of 2 μg/ml antimycin A. Antimycin A was added 1.5 min before glucose. The left panel shows intracellular concentrations for the WT strain in the absence of antimycin A as a reference. Metabolite concentrations were normalized to the highest concentration measured in all mutants over all time points. Actual concentrations corresponding to maximum and minimum values are shown on the right of the figure. Data represent the average of at least two independent experiments. Metabolite concentrations are provided in tabular form in Supplementary information II.
Figure 7
Time course of energy charge in trehalose-grown (A) wild-type, (B) amd1, (C) isn1, and (D) pnp1 mutant strains after sudden increase in glucose concentration to 110 mmol/l in the presence or absence of 2 μg/ml antimycin A. Antimycin A was added 1.5 min before glucose. Data represent the average of at least two independent experiments.
Figure 8
Intracellular metabolite concentrations in trehalose-grown wild-type and amd1 mutant strain after a sudden increase of glucose concentration to 110 mmol/l in the presence and absence of 2 μg/ml antimycin A. Antimycin A was added 1.5 min before glucose. (A) adenine nucleotides (AXP); (B) phosphoribosyl pyrophosphate (PRPP); (C) trehalose-6-phosphate (T6P); (D) glycerol-3-phosphate (G3P). Data represent the average of at least two independent experiments.
Figure 9
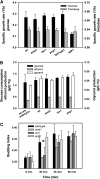
(A) Growth rates of mutants implicated in purine nucleotide cycling on glucose or trehalose as the limiting carbon source. Growth rates were measured in shake flask experiments at 30°C with initial concentrations of 20 g/l carbon source. Data represent the average of at least 3 independent experiments. (B) Glucose consumption, ethanol and glycerol production rates, respectively, in wild-type amd1, isn1, and pnp1 mutant strains after a sudden increase of glucose concentration to 22 mmol/l. Antimycin A was added at 2 μg/ml unless otherwise stated. (C) Budding index of trehalose-grown wild-type, amd1, isn1, and pnp1 mutant strains after a sudden increase of glucose concentration to 110 mmol/l in the presence of 2 μg/ml antimycin A. Antimycin A was added 1.5 min before glucose. Data represent the average of at least two independent experiments from which at least 600 cells were counted for each time point. The differences in budding index of the different strains were statistically analyzed for the time point at 30 min after glucose addition. (*) The budding index of wild-type and pnp1 mutant was significantly higher than for the amd1 and _isn_1 mutants with a confidence level of _P_=0.013. Measured values are provided in tabular form in Supplementary information III.
Figure 10
Schematic representation of pathways implicated in purine nucleotide cycling. Metabolites are depicted in black and enzymes in blue.
Similar articles
- Structure, cooperativity and inhibition of the inosine 5'-monophosphate-specific phosphatase from Saccharomyces cerevisiae.
Byun S, Park C, Suh JY, Witte CP, Rhee S. Byun S, et al. FEBS J. 2024 May;291(9):1992-2008. doi: 10.1111/febs.17093. Epub 2024 Feb 16. FEBS J. 2024. PMID: 38362806 - Metabolic phenotypes of Saccharomyces cerevisiae mutants with altered trehalose 6-phosphate dynamics.
Walther T, Mtimet N, Alkim C, Vax A, Loret MO, Ullah A, Gancedo C, Smits GJ, François JM. Walther T, et al. Biochem J. 2013 Sep 1;454(2):227-37. doi: 10.1042/BJ20130587. Biochem J. 2013. PMID: 23763276 - Phenotypic consequences of purine nucleotide imbalance in Saccharomyces cerevisiae.
Saint-Marc C, Pinson B, Coulpier F, Jourdren L, Lisova O, Daignan-Fornier B. Saint-Marc C, et al. Genetics. 2009 Oct;183(2):529-38, 1SI-7SI. doi: 10.1534/genetics.109.105858. Epub 2009 Jul 27. Genetics. 2009. PMID: 19635936 Free PMC article. - Nucleotide metabolism and cellular damage in myocardial ischemia.
Jennings RB, Steenbergen C Jr. Jennings RB, et al. Annu Rev Physiol. 1985;47:727-49. doi: 10.1146/annurev.ph.47.030185.003455. Annu Rev Physiol. 1985. PMID: 2581508 Review. - Transport of adenine nucleotides in the mitochondria of Saccharomyces cerevisiae: interactions between the ADP/ATP carriers and the ATP-Mg/Pi carrier.
Traba J, Satrústegui J, del Arco A. Traba J, et al. Mitochondrion. 2009 Apr;9(2):79-85. doi: 10.1016/j.mito.2009.01.001. Epub 2009 Jan 17. Mitochondrion. 2009. PMID: 19460304 Review.
Cited by
- GTP binding to translation factor eIF2B stimulates its guanine nucleotide exchange activity.
Kershaw CJ, Jennings MD, Cortopassi F, Guaita M, Al-Ghafli H, Pavitt GD. Kershaw CJ, et al. iScience. 2021 Nov 14;24(12):103454. doi: 10.1016/j.isci.2021.103454. eCollection 2021 Dec 17. iScience. 2021. PMID: 34877508 Free PMC article. - Autophagy provides metabolic substrates to maintain energy charge and nucleotide pools in Ras-driven lung cancer cells.
Guo JY, Teng X, Laddha SV, Ma S, Van Nostrand SC, Yang Y, Khor S, Chan CS, Rabinowitz JD, White E. Guo JY, et al. Genes Dev. 2016 Aug 1;30(15):1704-17. doi: 10.1101/gad.283416.116. Epub 2016 Aug 11. Genes Dev. 2016. PMID: 27516533 Free PMC article. - Assessing the physiological properties of baker's yeast based on single-cell Raman spectrum technology.
Sun X, Zhou X, Yu R, Zhou X, Zhang J, Xu T, Wang J, Li M, Li X, Zhang M, Xu J, Zhang J. Sun X, et al. Synth Syst Biotechnol. 2024 Sep 11;10(1):110-118. doi: 10.1016/j.synbio.2024.09.004. eCollection 2025. Synth Syst Biotechnol. 2024. PMID: 39493334 Free PMC article. - Fungicidal drugs induce a common oxidative-damage cellular death pathway.
Belenky P, Camacho D, Collins JJ. Belenky P, et al. Cell Rep. 2013 Feb 21;3(2):350-8. doi: 10.1016/j.celrep.2012.12.021. Epub 2013 Feb 14. Cell Rep. 2013. PMID: 23416050 Free PMC article. - Avoiding misannotation of in-source fragmentation products as cellular metabolites in liquid chromatography-mass spectrometry-based metabolomics.
Xu YF, Lu W, Rabinowitz JD. Xu YF, et al. Anal Chem. 2015 Feb 17;87(4):2273-81. doi: 10.1021/ac504118y. Epub 2015 Jan 27. Anal Chem. 2015. PMID: 25591916 Free PMC article.
References
- Arnvig K, Hove-Jensen B, Switzer RL (1990) Purification and properties of phosphoribosyl-diphosphate synthetase from Bacillus subtilis. Eur J Biochem 192: 195–200 - PubMed
- Atkinson DE, Fall L (1967) Adenosine triphosphate conservation in biosynthetic regulation. Escherichia coli phosphoribosylpyrophosphate synthase. J Biol Chem 242: 3241–3242 - PubMed
- Bailey JE (1991) Toward a science of metabolic engineering. Science 252: 1668–1675 - PubMed
- Banuelos M, Gancedo C, Gancedo JM (1977) Activation by phosphate of yeast phosphofructokinase. J Biol Chem 252: 6394–6398 - PubMed
- Bosch D, Johansson M, Ferndahl C, Franzen CJ, Larsson C, Gustafsson L (2008) Characterization of glucose transport mutants of Saccharomyces cerevisiae during a nutritional upshift reveals a correlation between metabolite levels and glycolytic flux. FEMS Yeast Res 8: 10–25 - PubMed
Publication types
MeSH terms
Substances
LinkOut - more resources
Full Text Sources
Other Literature Sources
Molecular Biology Databases
Research Materials


