Identification of candidate tumour suppressor genes frequently methylated in renal cell carcinoma - PubMed (original) (raw)
Identification of candidate tumour suppressor genes frequently methylated in renal cell carcinoma
M R Morris et al. Oncogene. 2010.
Abstract
Promoter region hyermethylation and transcriptional silencing is a frequent cause of tumour suppressor gene (TSG) inactivation in many types of human cancers. Functional epigenetic studies, in which gene expression is induced by treatment with demethylating agents, may identify novel genes with tumour-specific methylation. We used high-density gene expression microarrays in a functional epigenetic study of 11 renal cell carcinoma (RCC) cell lines. Twenty-eight genes were then selected for analysis of promoter methylation status in cell lines and primary RCC. Eight genes (BNC1, PDLIM4, RPRM, CST6, SFRP1, GREM1, COL14A1 and COL15A1) showed frequent (>30% of RCC tested) tumour-specific promoter region methylation. Hypermethylation was associated with transcriptional silencing. Re-expression of BNC1, CST6, RPRM and SFRP1 suppressed the growth of RCC cell lines and RNA interference knock-down of BNC1, SFRP1 and COL14A1 increased the growth of RCC cell lines. Methylation of BNC1 or COL14A1 was associated with a poorer prognosis independent of tumour size, stage or grade. The identification of these epigenetically inactivated candidate RCC TSGs can provide insights into renal tumourigenesis and a basis for developing novel therapies and biomarkers for prognosis and detection.
Figures
Figure 1
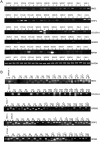
A, RT-PCR analysis of PDLIM4, CST6 and COL14A expression. PDLIM4 expression was restored (SKRC18, SKRC54, CAKI-1)/up-regulated (RCC4, KTCL140, 786-0) in 6 of 11 cell lines following treatment with the demethylating agent, 5-Aza-2′-deoxycytidine. CST6 expression was restored (KTCL26, SKRC18, SKRC54, 786-0, CAKI-1)/up-regulated (RCC4, KTCL140, SKRC45) in 8/11 cell lines. Global demethylation restored expression of COL14A in 5/11 cell lines (KTCL140, SKRC18, SKRC45, SKRC54, 786-0). B-D, Bisulphite sequencing analysis of PDLIM4, CST6 and COL14A1 5′ CpG island regions. Primers were designed to amplify the predicted promoter region of the 5′ CpG island of PDLIM4, CST6 and COL14A. The schematic represents the region sequenced; vertical lines indicate individual CpGs. Sequencing indicated methylation in RCC cell lines correlated with gene silencing/ down-regulation: black circle; complete methylation; grey circle; partial methylation; empty circle; no methylation. Bisulfite sequencing of RCC tumours and adjacent normal tissue showed frequent methylation in tumours and infrequent methylation in normal tissue (see results for details). Analysis of normal tissue derived from non-malignant kidneys indicated no CpG island methylation, with the exception of PDLIM4 in which 3 CpGs were partially and 1 CpG was fully methylated in 1 non-malignant sample (NMN2). T=Tumour, N= normal tissue adjacent to tumour, NMN= non-malignant normal tissue. Representative sequencing traces are shown in supplementary fig. 1.
Figure 2
A, RT-PCR analysis of BNC1, SFRP1 and COL15A1, GREM1, and RPRM expression. BNC1 expression was restored (RCC4, KTCL140, SKRC18)/up-regulated (SKRC45, 786-0) in 5 of 11 cell lines following treatment with the demethylating agent, 5-Aza-2′-deoxycytidine. SFRP1 expression was restored (RCC4, SKRC47)/up-regulated (KTCL140, SKRC18, SKRC45) in 5/11 cell lines. COL15A1 expression was restored (RCC4)/up-regulated (KTCL140, SKRC18, SKRC47, SKRC54) in 5/11 cell lines. GREM1 expression was restored (RCC4, SKRC140, SKRC54, CAKI-1)/up-regulated (SKRC39) in 5/11 cell lines following treatment with the demethylating agent, 5-Aza-2′-deoxycytidine. Global demethylation restored expression of RPRM in 3/11 cell lines (KTCL26, SKRC18, SKRC39). B, Methylation-specific PCR analysis of BNC1, SFRP1 and COL15A, GREM1, and RPRM1. MSP analysis showed frequent (34-53%) promoter methylation in tumours, infrequent or absent methylation in adjacent tissue and no methylation in samples derived from non-malignant normal tissue (see results for details). RCC tumour cell lines were used for each MSP assay as positive controls for methylated and unmethylated DNA. Representative samples are shown. M=product derived from methylation-specific primers; U= products derived from unmethylated specific primers, T= tumour sample, N= non-malignant sample, *=methylated tumours. MSP and USP product are of a similar size. Smaller bands are primer dimmers.
Figure 3
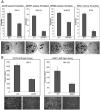
A, Re-expression of CST6, SFRP1, RPRM and BNC1 in RCC cells results in growth suppression. Exogenous re-expression of selected genes in RCC cell lines that do not express their respective genes resulted in a significant reduction of in vitro colony formation compared to RCC lines transfected with an empty vector (EV). Equal amounts of empty vector or pCDNA3.1-wt_CST6_, or pCDNA3.1-wt_SFRP1_, or pCDNA3.1-wt_RPRM,_ or pCDNA3.1-wt_BNC1_ were transfected into 786-O (CST6), SKRC47 (SFRP1), RCC4 (BNC1) or SKRC39 (RPRM) cells. Each experiment was done in triplicate. There was a statistically significant reduction of colonies in each of the re-expression experiments (p=0.003, p<0.0001, p<0.0001 and p=0.001 respectively). Shown below each graph are representative plates showing reduction of colonies following gene re-expression. **B, Re-expression of CST6 or over-expression of BNC1 inhibits anchorage-independent growth**. A, clones of 786-O-pCDNA3.1 and 786-0O-pCDNA3.1-wtCST6 or HEK293-pCDNA3.1 and HEK293-pCDNA3.1-wtBNC1were seeded at the same density into soft agar and incubated for 5 weeks. 786-O clones not expressing CST6 (pCDNA3.1) produced many large (>100 μm) colonies. In contrast, 786-O clones expressing exogenous wtCST6 did not grow as robustly. Three independent experiments showed a 53% reduction of large colonies (p=0.0001) after 5 weeks of incubation. Similarly exogenous over-expression of BNC1 resulted in 54% fewer large colonies (p=0.001). Below each graph is shown a representative image of clones after 5 weeks of incubation (X100 magnification).
Figure 4
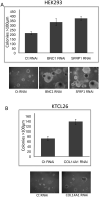
Knock-down of expression of BNC1, SFRP1 or COL14A1 increases anchorage-independent growth potential. A. RNAi-induced reduced expression of BNC1 or SFRP1 in HEK-293 cells resulted in the growth of significantly more colonies >100μm in diameter compared to cells transfected with a control RNAi oligo when seeded at the same density into soft agar (p<0.0001 in both cases). **B.** RNAi-induced reduced expression of _COL14A1_ in KTCL26 cells resulted in the growth of significantly more colonies >100μm in diameter compared to cells transfected with a control RNAi oligo when seeded at the same density into soft agar (p<0.0001).
Figure 5
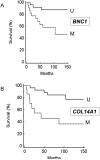
Panel A: Kaplan Meier survival analysis for BNC1 methylation status and Survival (M=methylated U=Unmethylated); Panel B: Kaplan Meier survival analysis for COL14A1 methylation status and survival (M=methylated U=Unmethylated); panel C: Kaplan Meier survival analysis for BNC1 methylation status and survival (M=methylated U=Unmethylated). Panel D: Cox proportional hazard analysis for COL14A1 methylation status (analysis also incorporates tumour stage. Grade and size and BNC1 methylation status).
Similar articles
- Functional epigenomics approach to identify methylated candidate tumour suppressor genes in renal cell carcinoma.
Morris MR, Gentle D, Abdulrahman M, Clarke N, Brown M, Kishida T, Yao M, Teh BT, Latif F, Maher ER. Morris MR, et al. Br J Cancer. 2008 Jan 29;98(2):496-501. doi: 10.1038/sj.bjc.6604180. Epub 2008 Jan 15. Br J Cancer. 2008. PMID: 18195710 Free PMC article. - Genome-wide methylation analysis identifies epigenetically inactivated candidate tumour suppressor genes in renal cell carcinoma.
Morris MR, Ricketts CJ, Gentle D, McRonald F, Carli N, Khalili H, Brown M, Kishida T, Yao M, Banks RE, Clarke N, Latif F, Maher ER. Morris MR, et al. Oncogene. 2011 Mar 24;30(12):1390-401. doi: 10.1038/onc.2010.525. Epub 2010 Dec 6. Oncogene. 2011. PMID: 21132003 - Epigenetic inactivation of the RASSF1A 3p21.3 tumor suppressor gene in both clear cell and papillary renal cell carcinoma.
Morrissey C, Martinez A, Zatyka M, Agathanggelou A, Honorio S, Astuti D, Morgan NV, Moch H, Richards FM, Kishida T, Yao M, Schraml P, Latif F, Maher ER. Morrissey C, et al. Cancer Res. 2001 Oct 1;61(19):7277-81. Cancer Res. 2001. PMID: 11585766 - [Aberrant methylation of tumor suppressor genes in renal cell carcinoma].
Zhang Q, Jin J, Tao Q. Zhang Q, et al. Ai Zheng. 2007 Nov;26(11):1276-80. Ai Zheng. 2007. PMID: 17991333 Review. Chinese. - DNA Methylation as Drug Sensitivity Marker in RCC: A Systematic Review.
Koudonas A, Dimitriadis G, Anastasiadis A, Papaioannou M. Koudonas A, et al. Epigenomes. 2024 Jul 15;8(3):28. doi: 10.3390/epigenomes8030028. Epigenomes. 2024. PMID: 39051186 Free PMC article. Review.
Cited by
- Epigenetics of kidney cancer and bladder cancer.
Hoffman AM, Cairns P. Hoffman AM, et al. Epigenomics. 2011 Feb;3(1):19-34. doi: 10.2217/epi.10.64. Epigenomics. 2011. PMID: 22126150 Free PMC article. Review. - Reexpression of tumor suppressor, sFRP1, leads to antitumor synergy of combined HDAC and methyltransferase inhibitors in chemoresistant cancers.
Cooper SJ, von Roemeling CA, Kang KH, Marlow LA, Grebe SK, Menefee ME, Tun HW, Colon-Otero G, Perez EA, Copland JA. Cooper SJ, et al. Mol Cancer Ther. 2012 Oct;11(10):2105-15. doi: 10.1158/1535-7163.MCT-11-0873. Epub 2012 Jul 23. Mol Cancer Ther. 2012. PMID: 22826467 Free PMC article. - Association between SFRP promoter hypermethylation and different types of cancer: A systematic review and meta-analysis.
Yu J, Xie Y, Li M, Zhou F, Zhong Z, Liu Y, Wang F, Qi J. Yu J, et al. Oncol Lett. 2019 Oct;18(4):3481-3492. doi: 10.3892/ol.2019.10709. Epub 2019 Aug 2. Oncol Lett. 2019. PMID: 31516566 Free PMC article. - GATA5 CpG island hypermethylation is an independent predictor for poor clinical outcome in renal cell carcinoma.
Peters I, Gebauer K, Dubrowinskaja N, Atschekzei F, Kramer MW, Hennenlotter J, Tezval H, Abbas M, Scherer R, Merseburger AS, Stenzl A, Kuczyk MA, Serth J. Peters I, et al. Oncol Rep. 2014 Apr;31(4):1523-30. doi: 10.3892/or.2014.3030. Epub 2014 Feb 18. Oncol Rep. 2014. PMID: 24549248 Free PMC article. - Clinical Significance of ADAMTS19, BMP7, SIM1, and SFRP1 Promoter Methylation in Renal Clear Cell Carcinoma.
Kubiliute R, Zalimas A, Bakavicius A, Ulys A, Jankevicius F, Jarmalaite S. Kubiliute R, et al. Onco Targets Ther. 2021 Oct 5;14:4979-4990. doi: 10.2147/OTT.S330341. eCollection 2021. Onco Targets Ther. 2021. PMID: 34675538 Free PMC article.
References
- Ai L, Kim WJ, Kim TY, Fields CR, Massoll NA, Robertson KD, Brown KD. Cancer Res. 2006;66:7899–909. - PubMed
- Amenta PS, Scivoletti NA, Newman MD, Sciancalepore JP, Li D, Myers JC. J Histochem Cytochem. 2005;53:165–76. - PubMed
- Awakura Y, Nakamura E, Ito N, Kamoto T, Ogawa O. Oncol Rep. 2007;20:1257–63. - PubMed
- Battagli C, Uzzo RG, Dulaimi E, Ibanez de Caceres I, Krassenstein R, Al-Saleem T, Greenberg RE, Cairns P. Cancer Res. 2003;63:8695–9. - PubMed
- Bellail AC, Hunter SB, Brat DJ, Tan C, Van Meir EG. Int J Biochem Cell Biol. 2004;36:1046–69. - PubMed
Publication types
MeSH terms
LinkOut - more resources
Full Text Sources
Other Literature Sources
Molecular Biology Databases
Research Materials
Miscellaneous


