Electrostatic interaction between oxysterol-binding protein and VAMP-associated protein A revealed by NMR and mutagenesis studies - PubMed (original) (raw)
Electrostatic interaction between oxysterol-binding protein and VAMP-associated protein A revealed by NMR and mutagenesis studies
Kyoko Furuita et al. J Biol Chem. 2010.
Abstract
Oxysterol-binding protein (OSBP), a cytosolic receptor of cholesterol and oxysterols, is recruited to the endoplasmic reticulum by binding to the cytoplasmic major sperm protein (MSP) domain of integral endoplasmic reticulum protein VAMP-associated protein-A (VAP-A), a process essential for the stimulation of sphingomyelin synthesis by 25-hydroxycholesterol. To delineate the interaction mechanism between VAP-A and OSBP, we determined the complex structure between the VAP-A MSP domain (VAP-A(MSP)) and the OSBP fragment containing a VAP-A binding motif FFAT (OSBP(F)) by NMR. This solution structure explained that five of six conserved residues in the FFAT motif are required for the stable complex formation, and three of five, including three critical intermolecular electrostatic interactions, were not explained before. By combining NMR relaxation and titration, isothermal titration calorimetry, and mutagenesis experiments with structural information, we further elucidated the detailed roles of the FFAT motif and underlying motions of VAP-A(MSP), OSBP(F), and the complex. Our results show that OSBP(F) is disordered in the free state, and VAP-A(MSP) and OSBP(F) form a final complex by means of intermediates, where electrostatic interactions through acidic residues, including an acid patch preceding the FFAT motif, probably play a collective role. Additionally, we report that the mutation that causes the familial motor neuron disease decreases the stability of the MSP domain.
Figures
FIGURE 1.
A, domain structures of human VAP-A and human OSBP are shown. MSP, major sperm protein; CC, coiled-coil; TM, transmembrane; PH, pleckstrin homology; LB, lipid binding. B, alignment of FFAT motifs of human lipid binding proteins and rat ORP1 is shown.
FIGURE 2.
Solution structure of the complex between VAP-A (6–125) and OSBP (358–366). A, shown is a superimposed representation of 20 lowest energy structures. B, shown is a ribbon representation of VAP-AMSP. OSBPF is shown as a stick model. C, shown are the electrostatic surfaces of VAP-AMSP (left) and OSBPF (right) contoured from −3 kT (red) to +3 kT (blue). The electrostatic potential was calculated using an amber force field.
FIGURE 3.
Details of the interaction. Residue numbers of OSBPF are written in italics. OSBPF is shown as a stick model. The surface of VAP-AMSP is represented with acidic (red), basic (blue), and hydrophobic (yellow) residues.
FIGURE 4.
A, backbone 1H,15N hetero-NOE values of OSBPF in the unbound (white bar) and bound (black bar) state are shown. Uncertainties were obtained using Monte Carlo simulations. B, shown are changes of S2 values of VAP-AMSP upon complex formation with OSBPF. Δ_S_2 = _S_2(complex) − _S_2(free). The region between Δ_S_2 = −0.1 ∼ 0.1 is shadowed. C, composite chemical shift changes of VAP-AMSP and OSBPF upon complex formation are shown. Composite chemical shift changes were calculated using the equation Δppm = {(ΔδH)2 + (ΔδN/5)2}1/2, where ΔδH and ΔδN represent the chemical shift changes of 1H and 15N, respectively.
FIGURE 5.
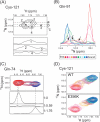
A, shown are cross-peaks of Cys-121 at a molar ratio of OSBPF to VAP-AMSP of 1:0. 44. In the upper panel, peaks are indicated by a cross and are labeled. The lower panel shows 1H cross-sections corresponding to lines a, b, and c in the upper panel. Numbers indicate corresponding peaks in the upper panel. B, shown is an overlay of 15N cross-sections of Gln-91 in a titration of VAP-AMSP with OSBPF. Molar ratios (VAP-AMSP:OSBPF) ranged from 1:0 (red) to 1:1.76 (blue). Peak tops at a molar ratio of 1:0.59 are shown by arrows. C, the upper panel shows an overlay of cross-peaks for Gln-74 at molar ratios of OSBPF of 0 (red), 0.59 (purple), and 1.76 (blue). The lower panel shows 1H cross-sections of peaks at each molar ratio. Corresponding peaks in the upper and lower panels are connected by dashed lines. D, shown is a comparison of cross-peaks for Cys-121 in titrations with OSBPF (WT) and the E356K mutant.
FIGURE 6.
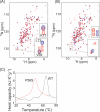
A, 1H,15N HSQC spectra of P56S (red) and WT (blue) VAP-AMSP are shown. In the boxed region, assignments of peaks of WT VAP-AMSP are indicated. B, 1H,15N HSQC spectra of P56S VAP-AMSP in the presence of OSBPF with a molar ratio of 1:2 (red) and in the absence of OSBPF (blue) are shown. C, DSC profiles of P56S (red) and WT (black) VAP-AMSP are shown.
Similar articles
- Sequence requirements of the FFAT-like motif for specific binding to VAP-A are revealed by NMR.
Furuita K, Hiraoka M, Hanada K, Fujiwara T, Kojima C. Furuita K, et al. FEBS Lett. 2021 Sep;595(17):2248-2256. doi: 10.1002/1873-3468.14166. Epub 2021 Aug 8. FEBS Lett. 2021. PMID: 34312846 - Vesicle-associated membrane protein-associated protein-A (VAP-A) interacts with the oxysterol-binding protein to modify export from the endoplasmic reticulum.
Wyles JP, McMaster CR, Ridgway ND. Wyles JP, et al. J Biol Chem. 2002 Aug 16;277(33):29908-18. doi: 10.1074/jbc.M201191200. Epub 2002 May 21. J Biol Chem. 2002. PMID: 12023275 - Oxysterol-binding proteins: sterol and phosphoinositide sensors coordinating transport, signaling and metabolism.
Olkkonen VM, Li S. Olkkonen VM, et al. Prog Lipid Res. 2013 Oct;52(4):529-38. doi: 10.1016/j.plipres.2013.06.004. Epub 2013 Jul 2. Prog Lipid Res. 2013. PMID: 23830809 Review. - VAP, a Versatile Access Point for the Endoplasmic Reticulum: Review and analysis of FFAT-like motifs in the VAPome.
Murphy SE, Levine TP. Murphy SE, et al. Biochim Biophys Acta. 2016 Aug;1861(8 Pt B):952-961. doi: 10.1016/j.bbalip.2016.02.009. Epub 2016 Feb 17. Biochim Biophys Acta. 2016. PMID: 26898182 Review.
Cited by
- Downregulation of VAPB expression in motor neurons derived from induced pluripotent stem cells of ALS8 patients.
Mitne-Neto M, Machado-Costa M, Marchetto MC, Bengtson MH, Joazeiro CA, Tsuda H, Bellen HJ, Silva HC, Oliveira AS, Lazar M, Muotri AR, Zatz M. Mitne-Neto M, et al. Hum Mol Genet. 2011 Sep 15;20(18):3642-52. doi: 10.1093/hmg/ddr284. Epub 2011 Jun 17. Hum Mol Genet. 2011. PMID: 21685205 Free PMC article. - Intrinsically unstructured domain 3 of hepatitis C Virus NS5A forms a "fuzzy complex" with VAPB-MSP domain which carries ALS-causing mutations.
Gupta G, Qin H, Song J. Gupta G, et al. PLoS One. 2012;7(6):e39261. doi: 10.1371/journal.pone.0039261. Epub 2012 Jun 13. PLoS One. 2012. PMID: 22720086 Free PMC article. - Efficient protein production method for NMR using soluble protein tags with cold shock expression vector.
Hayashi K, Kojima C. Hayashi K, et al. J Biomol NMR. 2010 Nov;48(3):147-55. doi: 10.1007/s10858-010-9445-5. Epub 2010 Sep 16. J Biomol NMR. 2010. PMID: 20844927 - Analysis of the key elements of FFAT-like motifs identifies new proteins that potentially bind VAP on the ER, including two AKAPs and FAPP2.
Mikitova V, Levine TP. Mikitova V, et al. PLoS One. 2012;7(1):e30455. doi: 10.1371/journal.pone.0030455. Epub 2012 Jan 19. PLoS One. 2012. PMID: 22276202 Free PMC article. - Investigation of the Role of Protein Kinase D in Human Rhinovirus Replication.
Guedán A, Swieboda D, Charles M, Toussaint M, Johnston SL, Asfor A, Panjwani A, Tuthill TJ, Danahay H, Raynham T, Mousnier A, Solari R. Guedán A, et al. J Virol. 2017 Apr 13;91(9):e00217-17. doi: 10.1128/JVI.00217-17. Print 2017 May 1. J Virol. 2017. PMID: 28228588 Free PMC article.
References
- Yang H. (2006) Trends Cell Biol. 16, 427–432 - PubMed
- Lehto M., Olkkonen V. M. (2003) Biochim. Biophys. Acta 1631, 1–11 - PubMed
- Wang P. Y., Weng J., Anderson R. G. (2005) Science 307, 1472–1476 - PubMed
- Wyles J. P., McMaster C. R., Ridgway N. D. (2002) J. Biol. Chem. 277, 29908–29918 - PubMed
Publication types
MeSH terms
Substances
LinkOut - more resources
Full Text Sources
Molecular Biology Databases
Research Materials


