Adaptation to oxygen deprivation in cultures of human pluripotent stem cells, endothelial progenitor cells, and umbilical vein endothelial cells - PubMed (original) (raw)
Adaptation to oxygen deprivation in cultures of human pluripotent stem cells, endothelial progenitor cells, and umbilical vein endothelial cells
Hasan Erbil Abaci et al. Am J Physiol Cell Physiol. 2010 Jun.
Abstract
Hypoxia plays an important role in vascular development through hypoxia-inducible factor-1alpha (HIF-1alpha) accumulation and downstream pathway activation. We sought to explore the in vitro response of cultures of human embryonic stem cells (hESCs), induced pluripotent stem cells (iPSCs), human endothelial progenitor cells (hEPCs), and human umbilical cord vein endothelial cells (HUVECs) to normoxic and hypoxic oxygen tensions. We first measured dissolved oxygen (DO) in the media of adherent cultures in atmospheric (21% O(2)), physiological (5% O(2)), and hypoxic oxygen conditions (1% O(2)). In cultures of both hEPCs and HUVECs, lower oxygen consumption was observed when cultured in 1% O(2). At each oxygen tension, feeder-free cultured hESCs and iPSCs were found to consume comparable amounts of oxygen. Transport analysis revealed that the oxygen uptake rate (OUR) of hESCs and iPSCs decreased distinctly as DO availability decreased, whereas the OUR of all cell types was found to be low when cultured in 1% O(2), demonstrating cell adaptation to lower oxygen tensions by limiting oxygen consumption. Next, we examined HIF-1alpha accumulation and the expression of target genes, including VEGF and angiopoietins (ANGPT; angiogenic response), GLUT-1 (glucose transport), BNIP3, and BNIP3L (autophagy and apoptosis). Accumulations of HIF-1alpha were detected in all four cell lines cultured in 1% O(2). Corresponding upregulation of VEGF, ANGPT2, and GLUT-1 was observed in response to HIF-1alpha accumulation, whereas upregulation of ANGPT1 was detected only in hESCs and iPSCs. Upregulation of BNIP3 and BNIP3L was detected in all cells after 24-h culture in hypoxic conditions, whereas apoptosis was not detectable using flow cytometry analysis, suggesting that BNIP3 and BNIP3L can lead to cell autophagy rather than apoptosis. These results demonstrate adaptation of all cell types to hypoxia but different cellular responses, suggesting that continuous measurements and control over oxygen environments will enable us to guide cellular responses.
Figures
Fig. 1.
Dissolved oxygen (DO) levels in normoxic and hypoxic cultures of human umbilical cord vein endothelial cells (HUVECs), human endothelial progenitor cells (hEPCs), human embryonic stem cells (hESCs), and induced pluripotent stem cells (iPSCs). A: sensor readings of DO levels in the media of HUVECs and hEPCs cultured in atmospheric, 5%, and 1% O2. B: sensor readings of DO levels in the media of hESCs and iPSCs cultured in atmospheric, 5%, and 1% O2. Values are means ± SD (n = 3). *P < 0.05; **P < 0.01; ***P < 0.001.
Fig. 2.
Cell growth in normoxic and hypoxic cultures of HUVECs, hEPCs, hESCs, and iPSCs. A: cell growth normalized to initial cell seeding after 72 h of culturing HUVECs and hEPCs in atmospheric, 5%, and 1% O2. B: cell growth normalized to initial cell seeding after 72 h of culturing hESCs and iPSCs in atmospheric, 5%, and 1% O2. Values are means ± SD (n = 3). *P < 0.05; **P < 0.01; ***P < 0.001.
Fig. 3.
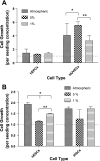
Oxygen uptake rate (OUR) analysis. OUR, normalized per cell, is shown in HUVEC and hEPC cultures (A) and in hESC and iPSC cultures (B) in atmospheric, 5%, and 1% O2. Values shown are means ± SD. **P < 0.01.
Fig. 4.
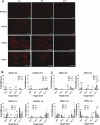
Hypoxic target gene regulation. A: immunofluorescence staining of hypoxia-inducible factor-1α (HIF-1α) HUVECs, hEPCs, hESCs, and iPSCs cultured in atmospheric, 5%, and 1% O2 for 5 h. Scale bars, 100 μm. B and C: relative changes in target gene expression from their expression in atmospheric O2 in hEPCs and HUVECs (B) and in hESCs and iPSCs (C) cultured in 5 and 1% O2. Values are means ± SD (n = 3). *P < 0.05; **P < 0.01; ***P < 0.001.
Fig. 5.
Autophagy and apoptotic genes. Relative changes in BNIP3 and BNIP3L upregulation from their expression in atmospheric O2 in HUVECs, hEPCs, hESCs, and iPSCs when cultured in 5 and 1% O2. Values are means ± SD (n = 3). *P < 0.05; **P < 0.01; ***P < 0.001.
Similar articles
- Increased activation of the hypoxia-inducible factor pathway in varicose veins.
Lim CS, Kiriakidis S, Paleolog EM, Davies AH. Lim CS, et al. J Vasc Surg. 2012 May;55(5):1427-39. doi: 10.1016/j.jvs.2011.10.111. Epub 2012 Jan 24. J Vasc Surg. 2012. PMID: 22277691 - Different Adaptive Responses to Hypoxia in Normal and Multiple Myeloma Endothelial Cells.
Filippi I, Saltarella I, Aldinucci C, Carraro F, Ria R, Vacca A, Naldini A. Filippi I, et al. Cell Physiol Biochem. 2018;46(1):203-212. doi: 10.1159/000488423. Epub 2018 Mar 21. Cell Physiol Biochem. 2018. PMID: 29587264 - Divergent regulation of angiopoietin-1, angiopoietin-2, and vascular endothelial growth factor by hypoxia and female sex steroids in human endometrial stromal cells.
Tsuzuki T, Okada H, Cho H, Shimoi K, Miyashiro H, Yasuda K, Kanzaki H. Tsuzuki T, et al. Eur J Obstet Gynecol Reprod Biol. 2013 May;168(1):95-101. doi: 10.1016/j.ejogrb.2012.12.040. Epub 2013 Jan 25. Eur J Obstet Gynecol Reprod Biol. 2013. PMID: 23352606 - Lowly expressed LNC01136 fails to aid HIF-1α to induce BTG2 expression resulting in increased proliferation of retinal microvascular endothelial cells.
Zhang L, Wang X. Zhang L, et al. Microvasc Res. 2022 May;141:104315. doi: 10.1016/j.mvr.2022.104315. Epub 2022 Jan 8. Microvasc Res. 2022. PMID: 35007537 Review. - Venous and arterial endothelial proteomics: mining for markers and mechanisms of endothelial diversity.
Richardson MR, Lai X, Witzmann FA, Yoder MC. Richardson MR, et al. Expert Rev Proteomics. 2010 Dec;7(6):823-31. doi: 10.1586/epr.10.92. Expert Rev Proteomics. 2010. PMID: 21142885 Free PMC article. Review.
Cited by
- Nonsteady state oxygen transport in engineered tissue: implications for design.
Ehsan SM, George SC. Ehsan SM, et al. Tissue Eng Part A. 2013 Jun;19(11-12):1433-42. doi: 10.1089/ten.TEA.2012.0587. Epub 2013 Mar 13. Tissue Eng Part A. 2013. PMID: 23350630 Free PMC article. - Antiangiogenic activity of 2-deoxy-D-glucose.
Merchan JR, Kovács K, Railsback JW, Kurtoglu M, Jing Y, Piña Y, Gao N, Murray TG, Lehrman MA, Lampidis TJ. Merchan JR, et al. PLoS One. 2010 Oct 27;5(10):e13699. doi: 10.1371/journal.pone.0013699. PLoS One. 2010. PMID: 21060881 Free PMC article. - Every Breath You Take: Non-invasive Real-Time Oxygen Biosensing in Two- and Three-Dimensional Microfluidic Cell Models.
Zirath H, Rothbauer M, Spitz S, Bachmann B, Jordan C, Müller B, Ehgartner J, Priglinger E, Mühleder S, Redl H, Holnthoner W, Harasek M, Mayr T, Ertl P. Zirath H, et al. Front Physiol. 2018 Jul 3;9:815. doi: 10.3389/fphys.2018.00815. eCollection 2018. Front Physiol. 2018. PMID: 30018569 Free PMC article. - BNIP3L/NIX-mediated mitophagy: molecular mechanisms and implications for human disease.
Li Y, Zheng W, Lu Y, Zheng Y, Pan L, Wu X, Yuan Y, Shen Z, Ma S, Zhang X, Wu J, Chen Z, Zhang X. Li Y, et al. Cell Death Dis. 2021 Dec 20;13(1):14. doi: 10.1038/s41419-021-04469-y. Cell Death Dis. 2021. PMID: 34930907 Free PMC article. Review. - Hypoxia Affects the Structure of Breast Cancer Cell-Derived Matrix to Support Angiogenic Responses of Endothelial Cells.
Hielscher A, Qiu C, Porterfield J, Smith Q, Gerecht S. Hielscher A, et al. J Carcinog Mutagen. 2013;Suppl 13:005. doi: 10.4172/2157-2518.S13-005. J Carcinog Mutagen. 2013. PMID: 24600535 Free PMC article.
References
- Allen JW, Khetani SR, Bhatia SN. In vitro zonation and toxicity in a hepatocyte bioreactor. Toxicol Sci 84: 110–119, 2005 - PubMed
- Andrews MT. Genes controlling the metabolic switch in hibernating mammals. Biochem Soc Trans 32: 1021–1024, 2004 - PubMed
- Asahara T, Masuda H, Takahashi T, Kalka C, Pastore C, Silver M, Kearne M, Magner M, Isner JM. Bone marrow origin of endothelial progenitor cells responsible for postnatal vasculogenesis in physiological and pathological neovascularization. Circ Res 85: 221–228, 1999 - PubMed
- Bevilacqua MP, Gimbrone MA., Jr Inducible endothelial functions in inflammation and coagulation. Semin Thromb Hemost 13: 425–433, 1987 - PubMed
Publication types
MeSH terms
Substances
LinkOut - more resources
Full Text Sources
Other Literature Sources
Miscellaneous


