Chloroquine activates the p53 pathway and induces apoptosis in human glioma cells - PubMed (original) (raw)
. 2010 Apr;12(4):389-400.
doi: 10.1093/neuonc/nop046. Epub 2010 Jan 27.
Robin Wüstenberg, Anne Rübsam, Christoph Schmitz-Salue, Gabriele Warnecke, Eva-Maria Bücker, Nadine Pettkus, Daniel Speidel, Veit Rohde, Walter Schulz-Schaeffer, Wolfgang Deppert, Alf Giese
Affiliations
- PMID: 20308316
- PMCID: PMC2940600
- DOI: 10.1093/neuonc/nop046
Chloroquine activates the p53 pathway and induces apoptosis in human glioma cells
Ella L Kim et al. Neuro Oncol. 2010 Apr.
Abstract
Glioblastoma is the most common malignant brain tumor in adults. The currently available treatments offer only a palliative survival advantage and the need for effective treatments remains an urgent priority. Activation of the p53 growth suppression/apoptotic pathway is one of the promising strategies in targeting glioma cells. We show that the quinoline derivative chloroquine activates the p53 pathway and suppresses growth of glioma cells in vitro and in vivo in an orthotopic (U87MG) human glioblastoma mouse model. Induction of apoptosis is one of the mechanisms underlying the effects of chloroquine on suppressing glioma cell growth and viability. siRNA-mediated downregulation of p53 in wild-type but not mutant p53 glioblastoma cells substantially impaired chloroquine-induced apoptosis. In addition to its p53-activating effects, chloroquine may also inhibit glioma cell growth via p53-independent mechanisms. Our results clarify the mechanistic basis underlying the antineoplastic effect of chloroquine and reveal its therapeutic potential as an adjunct to glioma chemotherapy.
Figures
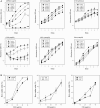
Fig. 1.
Chloroquine inhibits glioma cell growth and viability in culture. (A) Assessment of cell growth rates in glioma cells with known functional status of p53.31 Cells were treated with a range of chloroquine concentrations indicated in the legends. (B) Assessment of cell death rates in glioma cells lines with wtp53 (left panel) or deficient p53 function (middle and right panels). Values represent the mean of 6 replicates.
Fig. 2.
Chloroquine induces apoptosis in cultured glioma cells. (A and B) Time-dependent activation of caspase-3 by chloroquine in U87MG cells. Untreated or chloroquine-treated cells were stained for the cleaved form of caspase-3 and counterstained by DAPI. The inset in (A) shows the characteristic nuclear morphology of chloroquine-treated cells. (C) Summary of the caspase-3 activation assessment in glioma cells lines with different status of p53. The percentage of cells positive for cleaved caspase-3 was determined by counting a minimum of 500 cells in 5–10 microscopic fields in replicates of 3 for each condition. (D) Assessment of apoptosis in U87MG cells by TUNEL. A propidium iodide (PI) counterstain was used. (E) The effects of chloroquine on the mitochondrial membrane potential integrity assessed by measurements of the mitochondrial accumulation of fluorescent JC-1 in glioma cells with wtp53 (U87MG) or mutp53 (G112). The ratio of red/green JC-1 fluorescence was determined in cells untreated or treated with chloroquine for 24 or 48 hours.
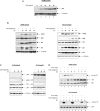
Fig. 3.
The p53 pathway is responsive to chloroquine. p53 protein and products of the known p53 targets p21, mdm2, bax1, or pig3 were assessed in glioma cell lines with different p53 status (A–C) and in the human colon carcinoma cell line HCT116 expressing wtp53 (B) by Western blot. Cells were treated with varying concentrations of chloroquine for 24 hours (A) or with a constant dose of chloroquine (30 µg/mL) for the indicated time periods (B and C). (D) Assessment of the p53 phosphorylation status at a serine residue Ser15 in U87MG (upper panel) and HCT116 (bottom panel) cells treated with chloroquine or ionizing radiation. The phosphorylated form of p53 (p53-Ser15P) was detected using a phosphorylation-sensitive antibody 16G8, which recognizes only the phosphorylated p53-Ser15P isoform. Total p53 detection was by antibody DO-7. The ubiquitously expressed cytoskeleton component α-tubulin or the basal transcription factor TBP was assessed to assure equal protein loading.
Fig. 4.
Inhibition of p53 diminishes apoptotic response to chloroquine in glioma cell lines with wtp53. (A) Assessment of the efficacy of endogenous p53 inhibition by transfection with unspecific scr-siRNA or p53-siRNA. U251 cells, which express high levels of endogenous mutp53 were transfected with scr-siRNA or p53-siRNA and stained with antibody DO-7 to ascertain the effect of siRNAs. (B) p53 inhibition by p53-siRNA diminished significantly (P < .02) the activation of caspase-3 in glioma cell lines with wtp53 but not in mutp53 lines. The percentage of cells with activated caspase-3 was determined by counting at least 500 cells in 5–10 microscopic fields from three replicate cover slips. The results shown represent the mean of two experiments.
Fig. 5.
Treatment of experimental glioma with chloroquine in vivo. Tumor volumes and mitotic and apoptotic indexes were determined in chloroquine- or PBS-treated U87MG tumors as described in the Materials and Methods section. (A) Chloroquine-treated tumors show a significant decrease in the average tumor volume and a lower mitotic index, but significantly elevated rates of apoptotic cells. The data analysis was performed using a one-way analysis of variance. (B) Representative hematoxylin/eosin-stained histological sections. The arrowheads indicate mitotic cells. (C) Representative TUNEL-stained histological sections. The arrowheads indicate TUNEL-positive cells.
Similar articles
- A novel p53 rescue compound induces p53-dependent growth arrest and sensitises glioma cells to Apo2L/TRAIL-induced apoptosis.
Weinmann L, Wischhusen J, Demma MJ, Naumann U, Roth P, Dasmahapatra B, Weller M. Weinmann L, et al. Cell Death Differ. 2008 Apr;15(4):718-29. doi: 10.1038/sj.cdd.4402301. Epub 2008 Jan 18. Cell Death Differ. 2008. PMID: 18202704 - Cobalt chloride treatment induces autophagic apoptosis in human glioma cells via a p53-dependent pathway.
Cheng BC, Chen JT, Yang ST, Chio CC, Liu SH, Chen RM. Cheng BC, et al. Int J Oncol. 2017 Mar;50(3):964-974. doi: 10.3892/ijo.2017.3861. Epub 2017 Jan 25. Int J Oncol. 2017. PMID: 28197638 - Antitumor activity of NVP-BKM120--a selective pan class I PI3 kinase inhibitor showed differential forms of cell death based on p53 status of glioma cells.
Koul D, Fu J, Shen R, LaFortune TA, Wang S, Tiao N, Kim YW, Liu JL, Ramnarian D, Yuan Y, Garcia-Echevrria C, Maira SM, Yung WK. Koul D, et al. Clin Cancer Res. 2012 Jan 1;18(1):184-95. doi: 10.1158/1078-0432.CCR-11-1558. Epub 2011 Nov 7. Clin Cancer Res. 2012. PMID: 22065080 Free PMC article. - The potential value of dequalinium chloride in the treatment of cancer: Focus on malignant glioma.
Pan Y, Zhao S, Chen F. Pan Y, et al. Clin Exp Pharmacol Physiol. 2021 Apr;48(4):445-454. doi: 10.1111/1440-1681.13466. Epub 2021 Jan 25. Clin Exp Pharmacol Physiol. 2021. PMID: 33496065 Review. - Changing paradigms in oncology: Toward noncytotoxic treatments for advanced gliomas.
von Knebel Doeberitz N, Paech D, Sturm D, Pusch S, Turcan S, Saunthararajah Y. von Knebel Doeberitz N, et al. Int J Cancer. 2022 Nov 1;151(9):1431-1446. doi: 10.1002/ijc.34131. Epub 2022 Jun 16. Int J Cancer. 2022. PMID: 35603902 Free PMC article. Review.
Cited by
- Global Effect of COVID-19 Pandemic on Cancer Patients and its Treatment: A Systematic Review.
Ali M, Wani SUD, Masoodi MH, Khan NA, Shivakumar HG, Osmani RMA, Khan KA. Ali M, et al. Clin Complement Med Pharmacol. 2022 Dec;2(4):100041. doi: 10.1016/j.ccmp.2022.100041. Epub 2022 Apr 25. Clin Complement Med Pharmacol. 2022. PMID: 36377228 Free PMC article. Review. - Phase 1 lead-in to a phase 2 factorial study of temozolomide plus memantine, mefloquine, and metformin as postradiation adjuvant therapy for newly diagnosed glioblastoma.
Maraka S, Groves MD, Mammoser AG, Melguizo-Gavilanes I, Conrad CA, Tremont-Lukats IW, Loghin ME, O'Brien BJ, Puduvalli VK, Sulman EP, Hess KR, Aldape KD, Gilbert MR, de Groot JF, Alfred Yung WK, Penas-Prado M. Maraka S, et al. Cancer. 2019 Feb 1;125(3):424-433. doi: 10.1002/cncr.31811. Epub 2018 Oct 25. Cancer. 2019. PMID: 30359477 Free PMC article. Clinical Trial. - IITZ-01, a novel potent lysosomotropic autophagy inhibitor, has single-agent antitumor efficacy in triple-negative breast cancer in vitro and in vivo.
Guntuku L, Gangasani JK, Thummuri D, Borkar RM, Manavathi B, Ragampeta S, Vaidya JR, Sistla R, Vegi NGM. Guntuku L, et al. Oncogene. 2019 Jan;38(4):581-595. doi: 10.1038/s41388-018-0446-2. Epub 2018 Aug 30. Oncogene. 2019. PMID: 30166591 - 2-Hydroxyglutarate-Mediated Autophagy of the Endoplasmic Reticulum Leads to an Unusual Downregulation of Phospholipid Biosynthesis in Mutant IDH1 Gliomas.
Viswanath P, Radoul M, Izquierdo-Garcia JL, Ong WQ, Luchman HA, Cairncross JG, Huang B, Pieper RO, Phillips JJ, Ronen SM. Viswanath P, et al. Cancer Res. 2018 May 1;78(9):2290-2304. doi: 10.1158/0008-5472.CAN-17-2926. Epub 2018 Jan 22. Cancer Res. 2018. PMID: 29358170 Free PMC article. - Functional analysis of a novel glioma antigen, EFTUD1.
Saito K, Iizuka Y, Ohta S, Takahashi S, Nakamura K, Saya H, Yoshida K, Kawakami Y, Toda M. Saito K, et al. Neuro Oncol. 2014 Dec;16(12):1618-29. doi: 10.1093/neuonc/nou132. Epub 2014 Jul 11. Neuro Oncol. 2014. PMID: 25015090 Free PMC article.
References
- Reardon DA, Wen PY. Therapeutic advances in the treatment of glioblastoma: rationale and potential role of targeted agents. Oncologist. 2006;11:152–164. - PubMed
- Lonardi S, Tosoni A, Brandes AA. Adjuvant chemotherapy in the treatment of high grade gliomas. Cancer Treat Rev. 2005;31:79–89. - PubMed
- Reardon DA, Rich JN, Friedman HS, Bigner DD. Recent advances in the treatment of malignant astrocytoma. J Clin Oncol. 2006;24:1253–1265. - PubMed
- Salhia B, Tran NL, Symons M, Winkles JA, Rutka JT, Berens ME. Molecular pathways triggering glioma cell invasion. Expert Rev Mol Diagn. 2006;6:613–626. - PubMed
- Terzis AJ, Niclou SP, Rajcevic U, Danzeisen C, Bjerkvig R. Cell therapies for glioblastoma. Expert Opin Biol Ther. 2006;6:739–749. - PubMed
Publication types
MeSH terms
Substances
LinkOut - more resources
Full Text Sources
Medical
Molecular Biology Databases
Research Materials
Miscellaneous


