Cell cycle dynamics of NG2 cells in the postnatal and ageing brain - PubMed (original) (raw)
Cell cycle dynamics of NG2 cells in the postnatal and ageing brain
Konstantina Psachoulia et al. Neuron Glia Biol. 2009 Nov.
Abstract
Oligodendrocyte precursors (OLPs or 'NG2 cells') are abundant in the adult mouse brain, where they continue to proliferate and generate new myelinating oligodendrocytes. By cumulative BrdU labelling, we estimated the cell cycle time TC and the proportion of NG2 cells that is actively cycling (the growth fraction) at approximately postnatal day 6 (P6), P60, P240 and P540. In the corpus callosum, TC increased from <2 days at P6 to approximately 9 days at P60 to approximately 70 days at P240 and P540. In the cortex, TC increased from approximately 2 days to >150 days over the same period. The growth fraction remained relatively invariant at approximately 50% in both cortex and corpus callosum - that is, similar numbers of mitotically active and inactive NG2 cells co-exist at all ages. Our data imply that a stable population of quiescent NG2 cells appears before the end of the first postnatal week and persists throughout life. The mitotically active population acts as a source of new oligodendrocytes during adulthood, while the biological significance of the quiescent population remains to be determined. We found that the mitotic status of adult NG2 cells is unrelated to their developmental site of origin in the ventral or dorsal telencephalon. We also report that new oligodendrocytes continue to be formed at a slow rate from NG2 cells even after P240 (8 months of age).
Conflict of interest statement
Statement of Interest
“Cycling and non-cycling populations of NG2 cells in the postnatal mouse brain” by Psachoulia, K., Jamen, F., Young, K.M., and Richardson, W.D.
There is no conflict of interest.
Figures
Figure 1
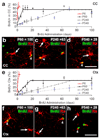
NG2 cells continue to proliferate throughout postnatal life in the corpus callosum and cortex. BrdU was administered to mice by subcutaneous injection or via their drinking water (see Methods) for up to 100 days starting on ~P6, P60 (2 months), P240 (8 months) or P540 (18 months). At various times after the start of BrdU administration, the number of BrdU+, PDGFRA+ cells was counted in the corpus callosum and cerebral cortex and expressed as a percentage of the total number of PDGFRA+ cells (a, e). BrdU+ (Alexa 568, shown green), PDGFRA+ (Alexa 647, shown red) NG2 cells could be detected readily in the grey (b-d) and white (f-h) matter at all ages. The point at which a plateau is reached indicates the fraction of the NG2 cell population that is actively cycling. Grey arrowheads indicate BrdU+, cycling NG2 cells and white arrowheads indicate non-cycling cells. CC, corpus callosum; Ctx, cortex. Scale bars: b-d and f-h, 20 µm
Figure 2
Quiescent NG2 cells appear before the end of the first postnatal week. BrdU was administered for ~3 days starting on P6 by repeated subcutaneous injections. (These data are the same as those shown in red in Fig 1a, e). At various times after the start of BrdU administration, BrdU+, PDGFRA+ cells were counted in the corpus callosum and cortex and expressed as a percentage of the total number of PDGFRA+ cells (a). BrdU+ (green), PDGFRA+ (red) NG2 cells could be detected readily in the grey and white matter at all BrdU labelling periods. Grey arrowheads indicate BrdU+ cycling NG2 cells and white arrowheads non-cycling cells (b-c). The white dashed line indicates the border between corpus callosum and cortical grey matter. CC, corpus callosum; Ctx, cortex. Scale bars: a-b, 60 µm
Figure 3
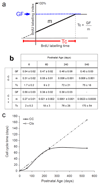
The NG2 cell cycle slows down during postnatal life. BrdU was administered to mice via their drinking water starting on P6, P60, P240 or P540 and the fraction (percentage) of PDGFRA+ NG2 cells that was BrdU+ was plotted versus the BrdU labelling period. (a) Calculation of cell cycle time (TC). The gradient (m) of the linear rising part of the graph was determined by the method of least squares (see Methods). The labelling index at plateau is the fraction of the population that is actively cycling (the growth fraction, GF). If the whole population were cycling GF would be 100%; in our experiments GF was closer to 50%. (b) Table of GF, m and TC for NG2 cells in the corpus callosum and cortex at the ages examined. (c) In the cortex there was a linear relationship between age and TC. In the corpus callosum TC reached a plateau after ~P240. CC, corpus callosum; Ctx, cortex
Figure 4
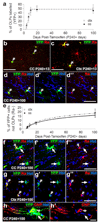
NG2 cells continue to produce oligodendrocytes after 8 months of age. To trace the fate of NG2 cells in the mature brain, tamoxifen was administered to Pdgfra-CreERT2 : Rosa26R-YFP mice starting on P240. (a) The proportion of PDGFRA+ cells that became YFP-labelled is plotted against time post-tamoxifen. Within ~10 days post-tamoxifen ~45% of PDGFRA+ (red) cells in the corpus callosum (b) and cortex (c) become stably labelled with YFP (green). Tracing the fate of YFP+ cells revealed that the great majority of YFP+ cells remained undifferentiated (PDGFRA+), even 100 days post-tamoxifen (P240+100). The proportion of YFP+ cells that were differentiated (PDGFRA-negative) increased slowly with time (e). YFP+, PDGFRA-negative cells with the morphology of differentiating oligodendrocytes were generated in both the corpus callosum (f) and cortex (g). (h) YFP+ cells (green) with the morphology of oligodendrocytes were found to co-stain for the differentiated oligodendrocyte marker CNPase (red). Grey arrowhead indicates a YFP+, PDGFRA+ NG2 cell, white arrow indicates a YFP+, PDGFRA-negative oligodendrocyte. CC, corpus callosum; Ctx, cortex. Scale bars: b-d, 35 µm; f-g, 30 µm.
Figure 5
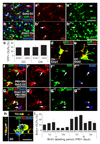
NG2 cells derived from both the dorsal and ventral VZ contribute to both the cycling and non-cycling populations. By crossing Gsh2-iCre or Emx1-iCre transgenic mice with Cre-sensitive Rosa26R- GFP reporter mice we were able to trace GFP+ (green), PDGFRA+ (red) NG2 cells that originated from either the embryonic LGE/MGE or the cortical VZ, respectively (a, b). (c) Numbers of GFP+, PDGFRA+ cells in the corpus callosum or cortex (3 sections from each of 6 mice) were expressed as a percentage of all PDGFRA+ cells in the same region. _Gsh2_- and _Emx1_-derived NG2 cells were found in approximately equal numbers in both corpus callosum and cortex (d, e). To determine whether Gsh2- and/or Emx1- derived NG2 cells were dividing, BrdU was administered via the drinking water for 6 or 35 days starting on P60 and brain sections were triple immunolabelled for BrdU (blue), PDGFRA (red) and GFP (green) (f, g). GFP+, PDGFRA+ cells were scored as BrdU-positive or –negative by examining confocal images with orthogonal projections (h). Numbers of BrdU+, GFP+, PDGFRA+ cells in corpus callosum and cortex were expressed as a percentage of all GFP+, PDGFRA+ cells in the same area. Both Gsh2- and Emx1- derived PDGFRA/NG2 cells contributed approximately equally to the cycling and non-cycling sub-populations. Grey arrowheads indicate (GFP+, PDGFRA+) double-positive (a, b) or (BrdU+, GFP+, PDGFRA+) triple-positive (f, g) cells. White arrows indicate a PDGFRA+ single-positive (a, b) or (GFP+, PDGFRA+) double-positive (f, g) cell. CC, corpus callosum; Ctx cortex. Scale bars: a-b, 40 µm; d-e, 10 µm; f-g, 17 µm; h, 6 µm.
Figure 6
The birth and behaviour of NG2 glia. From data presented in this paper and Kessaris et al., (2006), we conclude that adult forebrain OLPs/ NG2 cells are initially derived from embryonic VZ stem cells located in both the dorsal (cortical) and ventral (LGE/MGE) telencephalon. In this paper we show that their embryonic origin does not have any bearing on their mitotic activity as adult NG2 cells. A population of quiescent NG2 cells, comprising approximately half of all NG2 cells, appears some time before the end of the first postnatal week and persists throughout life. The function of these cells is unknown. The other half of the NG2 cell population remains in cycle throughout life, although their cell cycle length increases with age (e.g. from ~2 days at P6, to ~70 days at 8 months and >150 days at 18 months in the cortex). One major function of the proliferating OLPs is to generate new oligodendrocytes throughout life. However, the rate of oligodendrogenesis slows progressively with age, roughly in parallel with the decelerating cell cycle.
Similar articles
- PDGFRA/NG2 glia generate myelinating oligodendrocytes and piriform projection neurons in adult mice.
Rivers LE, Young KM, Rizzi M, Jamen F, Psachoulia K, Wade A, Kessaris N, Richardson WD. Rivers LE, et al. Nat Neurosci. 2008 Dec;11(12):1392-401. doi: 10.1038/nn.2220. Epub 2008 Oct 8. Nat Neurosci. 2008. PMID: 18849983 Free PMC article. - A developmental study on the expression of PDGFalphaR immunoreactive cells in the brain of postnatal rats.
He Y, Cai W, Wang L, Chen P. He Y, et al. Neurosci Res. 2009 Nov;65(3):272-9. doi: 10.1016/j.neures.2009.07.011. Epub 2009 Aug 7. Neurosci Res. 2009. PMID: 19665498 - Unbiased stereological analysis of the fate of oligodendrocyte progenitor cells in the adult mouse brain and effect of reference memory training.
Boulanger JJ, Messier C. Boulanger JJ, et al. Behav Brain Res. 2017 Jun 30;329:127-139. doi: 10.1016/j.bbr.2017.04.027. Epub 2017 Apr 23. Behav Brain Res. 2017. PMID: 28442356 - SomethiNG 2 talk about-Transcriptional regulation in embryonic and adult oligodendrocyte precursors.
Küspert M, Wegner M. Küspert M, et al. Brain Res. 2016 May 1;1638(Pt B):167-182. doi: 10.1016/j.brainres.2015.07.024. Epub 2015 Jul 29. Brain Res. 2016. PMID: 26232072 Review. - Identity, distribution, and development of polydendrocytes: NG2-expressing glial cells.
Nishiyama A, Watanabe M, Yang Z, Bu J. Nishiyama A, et al. J Neurocytol. 2002 Jul-Aug;31(6-7):437-55. doi: 10.1023/a:1025783412651. J Neurocytol. 2002. PMID: 14501215 Review.
Cited by
- Asymmetric cell division of stem and progenitor cells during homeostasis and cancer.
Gómez-López S, Lerner RG, Petritsch C. Gómez-López S, et al. Cell Mol Life Sci. 2014 Feb;71(4):575-97. doi: 10.1007/s00018-013-1386-1. Epub 2013 Jun 15. Cell Mol Life Sci. 2014. PMID: 23771628 Free PMC article. Review. - Functional genomic analyses highlight a shift in Gpr17-regulated cellular processes in oligodendrocyte progenitor cells and underlying myelin dysregulation in the aged mouse cerebrum.
Rivera AD, Pieropan F, Chacon-De-La-Rocha I, Lecca D, Abbracchio MP, Azim K, Butt AM. Rivera AD, et al. Aging Cell. 2021 Apr;20(4):e13335. doi: 10.1111/acel.13335. Epub 2021 Mar 5. Aging Cell. 2021. PMID: 33675110 Free PMC article. - NG2 cells (polydendrocytes): listeners to the neural network with diverse properties.
Hill RA, Nishiyama A. Hill RA, et al. Glia. 2014 Aug;62(8):1195-210. doi: 10.1002/glia.22664. Epub 2014 Apr 21. Glia. 2014. PMID: 24753030 Free PMC article. Review. - Repeated mild traumatic brain injury in female rats increases lipid peroxidation in neurons.
Yates NJ, Lydiard S, Fehily B, Weir G, Chin A, Bartlett CA, Alderson J, Fitzgerald M. Yates NJ, et al. Exp Brain Res. 2017 Jul;235(7):2133-2149. doi: 10.1007/s00221-017-4958-8. Epub 2017 Apr 17. Exp Brain Res. 2017. PMID: 28417146 - Low-Density Lipoprotein Receptor-Related Protein 1 (LRP1) Is a Negative Regulator of Oligodendrocyte Progenitor Cell Differentiation in the Adult Mouse Brain.
Auderset L, Pitman KA, Cullen CL, Pepper RE, Taylor BV, Foa L, Young KM. Auderset L, et al. Front Cell Dev Biol. 2020 Nov 13;8:564351. doi: 10.3389/fcell.2020.564351. eCollection 2020. Front Cell Dev Biol. 2020. PMID: 33282858 Free PMC article.
References
- Barres BA, Raff MC. Proliferation of oligodendrocyte precursor cells depends on electrical activity in axons. Nature. 1993;361:258–260. - PubMed
- Bartzokis G, Beckson M, Lu PH, Nuechterlein KH, Edwards N, Mintz J. Age-related changes in frontal and temporal lobe volumes in men: a magnetic resonance imaging study. Arch Gen Psychiatry. 2001;58:461–465. - PubMed
- Bartzokis G, Lu PH, Tingus K, Mendez MF, Richard A, Peters DG, Oluwadara B, Barrall KA, Finn JP, Villablanca P, Thompson PM, et al. Lifespan trajectory of myelin integrity and maximum motor speed. Neurobiol Aging. 2009 doi: 10.1016/j.neurobiolaging.2008.08.01. Epub in advance of print. - DOI - PMC - PubMed
- Bengtsson SL, Nagy Z, Skare S, Forsman L, Forssberg H, Ullen F. Extensive piano practicing has regionally specific effects on white matter development. Nat Neurosci. 2005;8:1148–1150. - PubMed
- Bergles DE, Roberts JD, Somogyi P, Jahr CE. Glutamatergic synapses on oligodendrocyte precursor cells in the hippocampus. Nature. 2000;405:187–191. - PubMed
Publication types
MeSH terms
Substances
LinkOut - more resources
Full Text Sources
Medical
Research Materials


