Persistent telomere damage induces bypass of mitosis and tetraploidy - PubMed (original) (raw)
Persistent telomere damage induces bypass of mitosis and tetraploidy
Teresa Davoli et al. Cell. 2010.
Abstract
Tetraploidization has been proposed as an intermediate step toward aneuploidy in human cancer but a general mechanism for the induction of tetraploidy during tumorigenesis is lacking. We report that tetraploidization occurs in p53-deficient cells experiencing a prolonged DNA damage signal due to persistent telomere dysfunction. Live-cell imaging revealed that these cells have an extended G2 due to ATM/ATR- and Chk1/Chk2-mediated inhibition of Cdk1/CyclinB and eventually bypass mitosis. Despite their lack of mitosis, the cells showed APC/Cdh1-dependent degradation of the replication inhibitor geminin, followed by accumulation of Cdt1, which is required for origin licensing. Cells then entered a second S phase resulting in whole-genome reduplication and tetraploidy. Upon restoration of telomere protection, these tetraploid cells resumed cell division cycles and proliferated. These observations suggest a general mechanism for the induction of tetraploidization in the early stages of tumorigenesis when telomere dysfunction can result from excessive telomere shortening.
Copyright 2010 Elsevier Inc. All rights reserved.
Figures
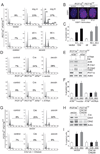
Figure 1. Polyploidy induced by persistent DNA damage signaling
(A) Polyploidization upon deletion of POT1a/b or continuous zeocin treatment. POT1aF/− POT1bF/F MEFs were treated with Cre, the vector control, zeocin, or left untreated and analyzed by FACS at the indicated time points The % cells with DNA content >4N is given. Representative FACS analyses are shown. (B) 53BP1 foci in POT1a/b DKO cells and zeocin-treated cells. POT1aF/−POT1bF/F MEFs were treated with Cre, zeocin, or left untreated as in (A) and processed for IF for 53BP1 (red) (DNA stained with DAPI (blue)). Average 53BP1 foci/nucleus and SEMs are given (n>50). (C) Quantification of polyploidy induced by POT1a/b deletion or continuous zeocin. POT1aF/−POT1bF/F MEFs were treated and analyzed as in (A). The bars show the average values and SDs of 3 independent experiments. (D, E F) Diminished polyploidy after inhibition of ATM and ATR. POT1aF/−POT1bF/FATM−/− and POT1aF/−POT1bF/FATM+/− were treated with ATR shRNA or vector control. Polyploidy was measured as in (A). FACS profiles from a representative experiment (D) and quantification of the percentage of polyploid cells in 3 independent experiments with SDs (F) are shown. Immunoblotting showing ATR knockdown and phosphorylation of Chk1 and Chk2 in the indicated cells is shown in (E). See also related Fig. S1C–E. (G, H, I) Diminished polyploidy after impairment of Chk1 and Chk2. POT1aF/−POT1bF/F MEFs were treated with Chk1 and Chk2 shRNAs (set 1) or vector control. Polyploidy was measured as in (D). FACS profiles from a representative experiment (G) and quantification of the percentage of polyploid cells in 3 independent experiments with SD (I) are shown. Immunoblotting showing Chk1 and Chk2 knockdown is in (H). See also related Fig. S1F, G.
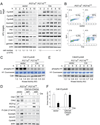
Figure 2. Impaired activity of Cdk1/CyclinB and APC/Cdc20
(A) Abnormal stabilization of mitotic APC targets in POT1a/b DKO cells. POT1aF/−POT1bF/F MEFs were treated with Cre and 2 days later synchronized in G1/S. The indicated proteins were analyzed by immunoblotting and the cell number at the corresponding time points is indicated below the blots. (B) S phase progression of cells used in (A). FACS analysis of BrdU positive cells at 0 and 4 hours after release from double thymidine (G1/S) block. (C, E) Reduced Cdk1/CyclinB activity in POT1a/b DKO cells. POT1aF/−POT1bF/F MEFs were treated as in (A) and the activity of Cdk1/CyclinB (C) and Cdk2/CyclinE (E) complexes was measured by histone H1-kinase assay. Phopho-histone-H1, Coomassie staining of histone H1, immunoblotting showing Cdk1 (C) and Cdk2 (E) in IPs and quantification of kinase activity are shown. See also related Fig. S2A. (D, F) Impairment in Cdk1/CyclinB and APC/Cdc20 activation in POT1a/b DKO cells is dependent on Chk1 and/or Chk2. POT1aF/−POT1bF/F MEFs were treated with Cre and two sets of Chk1 and Chk2 shRNAs. Immunoblotting for the indicated proteins is shown (D). Quantification of Cdk1/CyclinB kinase activity (as in (C)) after knockdown of Chk1 and Chk2 (set 1) in two independent experiments with SD is shown (F). See also related Fig. S2B.
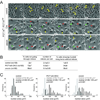
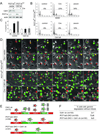
Figure 3. By-pass of mitosis in POT1a/b DKO and zeocin treated cells
(A) Time-lapse imaging of POT1aF/−POT1bF/F MEFs treated with Cre, cells treated with zeocin, and the untreated controls. After 72 hours, phase contrast microscope images were taken every 15 minutes for 48 hours (Movie S1). Selected time points stills are shown. Arrows of the same color highlight the same cell over the course of the imaging session. In POT1a/b DKO and zeocin-treated cells, arrows highlight representative cells not undergoing mitosis. See also related Fig. S3. (B) Quantification of cells not undergoing mitosis and the average number of mitoses per cell. Cells were treated and imaged as in (A) and the movies were analyzed. The percentage of cells showing CyclinE rising twice without an intervening mitosis in 48 hours is also shown. Cells expressing CyclinE-eGFP were analyzed as in (A) (representative movies in Movie S2). At least 100 cells in each movie were analyzed for each condition. Average values and SDs were obtained from 3 independent experiments. (C) Increased nuclear area of POT1a/b DKO and zeocin treated cells. Cells were treated and imaged as in (A). For each condition, the nuclear area of 100 cells was measured at the beginning (0 h) and at the end (48 h) of the imaging session and displayed as a frequency distribution. P values based on non-parametric Krustal-Wallis test. The results are representative of three independent experiments.
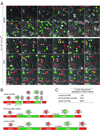
Figure 4. Geminin and Cdt1 alternate in POT1a/b DKO and zeocin treated cells
(A) FUCCI imaging of geminin and Cdt1. Time lapse imaging of POT1aF/−POT1bF/F MEFs transduced with FUCCI lentiviral vectors, expressing mKO2-hCdt1 (red) and mAG-hGeminin (green). Cells were treated with Cre or vector control and imaged after 72 h. Phase contrast images and fluorescent images using GFP and rhodamine filters were taken every 15 min (Movie S3). Selected time points are shown. Arrows with the same orientation highlight the same cell at different times. In control cells, arrows highlight one cell progressing through a normal cell cycle (red-yellow-green, mitosis) and its daughters until they move out of the field. In Cre-treated cells, arrows highlight two representative cells showing the color sequence red-yellow-green-red-yellow-green without intervening mitotis. (B) Duration of alternating geminin and Cdt1 expression in endoreduplicating cells. POT1aF/−POT1bF/F MEFs treated with vector control, Cre, (POT1a/b DKO) or zeocin (Movie S3) were imaged as in (A). The indicated number of cells was followed throughout the imaging session and the length of G1 (red), entry into S phase (yellow) and S/G2 (green) was measured. Average values (h) are shown. See also related Fig. S4A. (C) Quantification of geminin degradation in the absence of mitosis. Cells were treated and imaged as above and the movies were analyzed for cells showing at least one event of geminin degradation in the absence of mitosis. >100 cells were scored for each condition. Average values and SDs were obtained from 4 independent experiments. See also related Fig. S4.
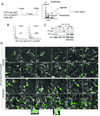
Figure 5. Involvement of Cdh1 in endoreduplication
(A–C) Knockdown of Cdh1 inhibits polyploidization. POT1aF/−POT1bF/F MEFs were treated with shRNA to knockdown Cdh1 (immunoblot in (A) and polyploidy was measured after POT1a/b deletion by Cre expression, zeocin treatment, or in untreated cells. FACS profiles from a representative experiment (B) and quantification of the percentage of polyploid cells in 3 independent experiments with SDs (C) are shown. (D) Diminished geminin degradation after Cdh1 knockdown. POT1aF/−POT1bF/F MEFs transduced with FUCCI vectors were treated with Cre, followed by Cdh1 shRNA or vector control infections a day later. Two days later, the cells were imaged for 60 hours (Movie S6) and selected time points of a representative experiment are shown. Arrows with the same orientation highlight the same cell over time. In Cre-treated cells two representative cells showing geminin degradation without mitosis are highlighted. In cells treated with Cre and Cdh1 shRNA, arrows highlight two cells showing prolonged arrest in G2 and persistence of geminin. (E) Schematic of FUCCI imaging data obtained on POT1a/b DKO cells treated with Cdh1 shRNA. Cells were treated and imaged as in (D). Cells treated with Cdh1 shRNA only were imaged separately (Movie S6). The indicated number of cells were followed throughout the imaging session to determine the length of G1 (red), entry into S phase (yellow), and S/G2 (green). Average values (h) are shown. (F) Table showing the effect of Cdh1 knockdown on mitosis-independent geminin degradation. Cells were treated and imaged as in (D) and (E). At least 100 cells were followed throughout the movie and the percentage of cells showing at least one event of geminin degradation without mitosis was determined. Average values and SDs were obtained from 3 independent experiments. See also related Fig. S5.
Figure 6. Re-establishment of cell division cycles after tetraploidization
(A) Schematics of the experimental approach. H2B-GFP expressing cells POT1aF/−POT1bF/F MEFs transduced with POT1a under the control of the Tet-Off inducible promoter were treated with Cre and cloned. Data on one clone (#19) is shown. After 7 days of treatment with doxycycline (doxy) to repress POT1a, cell line #19 was stained with Hoechst and FACS-sorted for DNA content. G1 diploid cells (2N peak) and G2 tetraploid cells (8N peak) were separated, plated in the absence of doxyxycline and monitored by time lapse imaging. (B) Induction of polyploidy after treatment with doxycycline. Clone #19 described in (A) was analyzed by FACS (PI staining) after 7 days in doxycycline. (C) Reversible expression of POT1a and silencing of the DNA damage signal. Immunoblotting for the indicated proteins in cell line #19 is shown after 3 or 5 days of doxycycline treatment and 5 days after its removal (day 12) in sorted diploid and tetraploid cells. (D) Cell divisions of diploid and tetraploid cells derived from clone #19 after re-expression of POT1a. Time lapse imaging of diploid and tetraploid cells expressing H2B-GFP was started 24 hours after doxyxcycline removal. Phase contrast and GFP-fluorescent images were taken every 15 minutes (Movie S8). Selected time points are shown. Arrows highlight a cell performing multiple cell divisions during the imaging session. Insets show evidence for multipolar mitoses.
Figure 7. Model for telomere-driven tetraploidization in cancer
Simplified cartoon illustrating how telomere attrition might induce tetraploidization. Critically short telomeres resulting from telomere attrition are proposed to lead to a persistent DNA damage response. In p53 deficient cells, no G1/S arrest and senescence/apoptotic response to the DNA damage will occur. Activation of the ATM/ATR kinase pathway will lead to permanent inhibition of Cdk1/CyclinB, blocking mitosis. The cells are then able to by-pass mitosis and re-enter S phase (due to the degradation of geminin by APC/Cdh1), becoming tetraploid. Some of these cells might carry diplochromosomes as shown in the cartoon. Activation or upregulation of telomerase will be required for the restoration of telomere function, thereby silencing the DNA damage response and allowing proliferation of tetraploid clones.
Similar articles
- Cyclin A2-cyclin-dependent kinase 2 cooperates with the PLK1-SCFbeta-TrCP1-EMI1-anaphase-promoting complex/cyclosome axis to promote genome reduplication in the absence of mitosis.
Ma HT, Tsang YH, Marxer M, Poon RY. Ma HT, et al. Mol Cell Biol. 2009 Dec;29(24):6500-14. doi: 10.1128/MCB.00669-09. Epub 2009 Oct 12. Mol Cell Biol. 2009. PMID: 19822658 Free PMC article. - Chk1 suppresses bypass of mitosis and tetraploidization in p53-deficient cancer cells.
Wilsker D, Chung JH, Bunz F. Wilsker D, et al. Cell Cycle. 2012 Apr 15;11(8):1564-72. doi: 10.4161/cc.19944. Epub 2012 Apr 15. Cell Cycle. 2012. PMID: 22433954 Free PMC article. - Telomere-driven tetraploidization occurs in human cells undergoing crisis and promotes transformation of mouse cells.
Davoli T, de Lange T. Davoli T, et al. Cancer Cell. 2012 Jun 12;21(6):765-76. doi: 10.1016/j.ccr.2012.03.044. Cancer Cell. 2012. PMID: 22698402 Free PMC article. - Non-mitotic functions of the Anaphase-Promoting Complex.
Eguren M, Manchado E, Malumbres M. Eguren M, et al. Semin Cell Dev Biol. 2011 Aug;22(6):572-8. doi: 10.1016/j.semcdb.2011.03.010. Epub 2011 Mar 23. Semin Cell Dev Biol. 2011. PMID: 21439391 Review. - Anaphase-promoting complex-dependent proteolysis of cell cycle regulators and genomic instability of cancer cells.
Wäsch R, Engelbert D. Wäsch R, et al. Oncogene. 2005 Jan 6;24(1):1-10. doi: 10.1038/sj.onc.1208017. Oncogene. 2005. PMID: 15637585 Review.
Cited by
- A Fungicide, Fludioxonil, Formed the Polyploid Giant Cancer Cells and Induced Metastasis and Stemness in MDA-MB-231 Triple-Negative Breast Cancer Cells.
Go RE, Seong SM, Choi Y, Choi KC. Go RE, et al. Int J Mol Sci. 2024 Aug 20;25(16):9024. doi: 10.3390/ijms25169024. Int J Mol Sci. 2024. PMID: 39201710 Free PMC article. - Absolute quantification of somatic DNA alterations in human cancer.
Carter SL, Cibulskis K, Helman E, McKenna A, Shen H, Zack T, Laird PW, Onofrio RC, Winckler W, Weir BA, Beroukhim R, Pellman D, Levine DA, Lander ES, Meyerson M, Getz G. Carter SL, et al. Nat Biotechnol. 2012 May;30(5):413-21. doi: 10.1038/nbt.2203. Nat Biotechnol. 2012. PMID: 22544022 Free PMC article. - Short telomeres result in chromosomal instability in hematopoietic cells and precede malignant evolution in human aplastic anemia.
Calado RT, Cooper JN, Padilla-Nash HM, Sloand EM, Wu CO, Scheinberg P, Ried T, Young NS. Calado RT, et al. Leukemia. 2012 Apr;26(4):700-7. doi: 10.1038/leu.2011.272. Epub 2011 Oct 18. Leukemia. 2012. PMID: 22005790 Free PMC article. - Nucleolar organization, ribosomal DNA array stability, and acrocentric chromosome integrity are linked to telomere function.
Stimpson KM, Sullivan LL, Kuo ME, Sullivan BA. Stimpson KM, et al. PLoS One. 2014 Mar 24;9(3):e92432. doi: 10.1371/journal.pone.0092432. eCollection 2014. PLoS One. 2014. PMID: 24662969 Free PMC article. - Inherited mutations in the helicase RTEL1 cause telomere dysfunction and Hoyeraal-Hreidarsson syndrome.
Deng Z, Glousker G, Molczan A, Fox AJ, Lamm N, Dheekollu J, Weizman OE, Schertzer M, Wang Z, Vladimirova O, Schug J, Aker M, Londoño-Vallejo A, Kaestner KH, Lieberman PM, Tzfati Y. Deng Z, et al. Proc Natl Acad Sci U S A. 2013 Sep 3;110(36):E3408-16. doi: 10.1073/pnas.1300600110. Epub 2013 Aug 19. Proc Natl Acad Sci U S A. 2013. PMID: 23959892 Free PMC article.
References
- Artandi SE, Chang S, Lee SL, Alson S, Gottlieb GJ, Chin L, DePinho RA. Telomere dysfunction promotes non-reciprocal translocations and epithelial cancers in mice. Nature. 2000;406:641–645. - PubMed
- Barlow C, Hirotsune S, Paylor R, Liyanage M, Eckhaus M, Collins F, Shiloh Y, Crawley JN, Ried T, Tagle D, Wynshaw-Boris A. Atm-deficient mice: a paradigm of ataxia telangiectasia. Cell. 1996;86:159–171. - PubMed
Publication types
MeSH terms
Substances
LinkOut - more resources
Full Text Sources
Other Literature Sources
Molecular Biology Databases
Research Materials
Miscellaneous
