Progressive activation of CyclinB1-Cdk1 coordinates entry to mitosis - PubMed (original) (raw)
Progressive activation of CyclinB1-Cdk1 coordinates entry to mitosis
Olivier Gavet et al. Dev Cell. 2010.
Abstract
The CyclinB1-Cdk1 kinase is the catalytic activity at the heart of mitosis-promoting factor (MPF), yet fundamental questions concerning its role in mitosis remained unresolved. It is not known when and how rapidly CyclinB1-Cdk1 is activated in mammalian cells, nor how its activation coordinates the substantial changes in the cell at mitosis. Here, we have developed a FRET biosensor specific for CyclinB1-Cdk1 that enables us to assay its activity with very high temporal precision in living human cells. We show that CyclinB1-Cdk1 is inactive in G2 phase and activated at a set time before nuclear envelope breakdown, thereby initiating the events of prophase. CyclinB1-Cdk1 levels rise to their maximum extent over the course of approximately 30 min, and we demonstrate that different levels of CyclinB1-Cdk1 kinase activity trigger different mitotic events, thus revealing how the remarkable reorganization of the cell is coordinated at mitotic entry.
Copyright 2010 Elsevier Inc. All rights reserved.
Figures
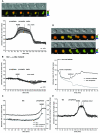
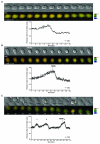
Figure 1. FRET dynamics during mitotic progression
A. HeLa cells expressing the CyclinB1-Cdk1 activity sensor were recorded at 1 image/1’40 ”. Top: IMD representation of the FRET dynamics during mitotic progression. Bottom: Average curve of the quantification of the emission ratio over time in different cells (n=6). Quantification curves were aligned on NEBD and were eventually interrupted in prometaphase (double vertical line) to be aligned at the onset of anaphase. Note that the emission ratio is slightly lower in G1 than in G2. This seems to be due to a differential bleaching of YFP versus CFP during recording and cell rounding in some HeLa cells. Note that this decline is not seen in RPE cells (see Fig.1E). B. Average quantification curve of HeLa cells expressing the inactive CyclinB1-Cdk1 activity sensor containing the Ser126 to Ala mutation (n=5). The slight decrease in the emission ratio during mitosis is due to cell rounding up and differential bleaching of YFP versus CFP. C. Quantification of the emission ratio for the whole cell, the nucleus or the cytoplasm only in a HeLa cell progressing from G2 to mitosis. D. Dynamics of FRET signal during re-entry to mitosis. HeLa cells co-expressing the CyclinB1-Cdk1 activity sensor and a non-degradable CyclinB1L42A/R45A-mCherry were arrested in metaphase and forced to exit mitosis by adding 300 nM Cdk inhibitor III (t=0). After ~27 min the drug was extensively washed out. The top cell re-enters mitosis whereas the bottom cell does not. The quantification curves of the 2 cells are displayed. Note that in this figure the FRET level in prometaphase was set at 100%. E. Average curve of the quantification of the emission ratio during mitosis in RPE cells (n=5) expressing the CyclinB1-Cdk1 activity sensor. Curves were aligned on NEBD and the onset of anaphase as in A.
Figure 2. Plk1 activity is required for mitotic entry but not for CyclinB1-Cdk1 activation per se
A. The FRET signal was recorded (1 image/2min) during mitotic entry in HeLa cells expressing the CyclinB1-Cdk1 activity sensor before (left panel) and after (right panel) addition of Plk1 inhibitor BI2536 (100 nM) to the same dish. Average curve of 3 cells is displayed for each condition. B. RPE cells were synchronized in G2 phase by release from serum starvation and recorded at 1 image/2 min by DIC microscopy. The peak of mitotic entry is indicated by vertical dashed lines (~27-32h after serum re-addition). The addition of the Plk1 inhibitor BI2536 100 nM rapidly induces a strong delay in mitotic entry.
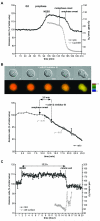
Figure 3. FRET dynamics during normal mitotic exit and mitotic slippage
A. HeLa cells co-expressing the CyclinB1-Cdk1 biosensor and CyclinB1-mCherry were recorded during mitotic progression (1 image/1’40”). The FRET signal and the decrease of CyclinB1-mCherry fluorescence intensity (a measure of its proteolysis) during mitotic exit are displayed. B. HeLa cells expressing the CyclinB1-Cdk1 activity sensor were recorded at 1 image/min until the beginning of anaphase at which point Cdk 1/2 inhibitor III (300 nM) was added and images taken at 1 image/10 sec. Note that there is no change in the rate of FRET decrease after adding the Cdk inhibitor in anaphase (n=6/6). C. RPE cells expressing the CyclinB1-Cdk1 biosensor were synchronized in G0 by serum starvation and 24h after release, 200 nM nocodazole was added. The FRET signal was recorded 4 hr after addition of nocodazole at 1 image/4 min. Quantification of the emission ratio and the cell surface area at mitotic exit in one typical cell is displayed. Note that the emission ratio is stable during ~13.2h and rapidly decreases during mitotic exit (n=5/5).
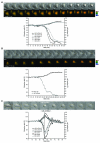
Figure 4. Cell rounding in prophase is concurrent with initial activation of CyclinB1-Cdk1
A. Asynchronous HeLa cells expressing the CyclinB1-Cdk1 biosensor were recorded (1 image/2 min) and the FRET signal and surface area measured. Quantifications of the emission ratio and cell surface of 3 cells entering mitosis are displayed. B. RPE cell expressing the CyclinB1-Cdk1 sensor was followed by time-lapse fluorescence microscopy at 1 image/1’15 min. The quantification curves of the cell are displayed. C. Cell rounding up in prophase is reversed by a Cdk inhibitor. The changes in cell surface and FRET efficiency were measured on synchronized HeLa cells recorded at 1 image/2 min as they entered prophase, then every minute after addition of Cdk1/2 inhibitor III (300 nM). The star indicates the cell displayed.
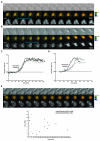
Figure 5. Centrosome separation is not a consistent marker for CyclinB1 activation
A&C. Asynchronous HeLa cells co-expressing the CyclinB1-Cdk1 biosensor and mCherry-α–tubulin were followed by time-lapse fluorescence microscopy at 1 image/2 min. The FRET quantification curves of 3 different cells are displayed and the beginning of centrosome migration for each cell is indicated by a vertical dashed line (C). B&D. Synchronized RPE cells co-expressing the CyclinB1-Cdk1 sensor and mCherry-α-tubulin were followed by time-lapse fluorescence microscopy at 1 image/2 min. The FRET quantification curves of 3 different cells are displayed. The beginning of centrosome migration for each cell is indicated by a vertical dashed line (D). E. HeLa cells co-expressing the CyclinB1-Cdk1 biosensor and mCherry- α-tubulin were synchronized in S phase by a thymidine block and release regime and assayed by time-lapse fluorescence and DIC microscopy. Upper panel: In the cell displayed the centrosomes separated >50 min before NEBD. Bottom panel: time between beginning of FRET increase and centrosome separation in typical experiments using asynchronous (n=14) or synchronized (n=12) HeLa cells. Note that centrosome separation begins at random during G2 phase in synchronised HeLa cells.
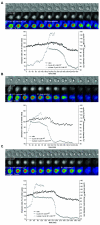
Figure 6. NEBD requires high levels of CyclinB1-Cdk1 activity
HeLa cells co-expressing the CyclinB1-Cdk1 biosensor and Cdk1AF-mCherry. Three cells entering M phase-like states without cytokinesis are displayed. Low CyclinB1-Cdk1 activity, visualised by a weak increase in FRET activity, is sufficient to trigger cell rounding up (cell A and the two first M phase-like states of cell C) but higher levels are required for NEBD (cell B and third M phase-like state of cell C).
Figure 7. CyclinB1 degradation is triggered by low levels of CyclinB1-Cdk1 activity and is independent of NEBD
HeLa cells co-expressing the CyclinB1-Cdk1 biosensor and a CyclinB1-Cdk1AF-mCherry fusion protein. Three cells entering M phase-like states without cytokinesis are displayed. Low CyclinB1-Cdk1 activity, visualised by a weak increase in FRET activity, is sufficient to trigger nuclear import of CyclinB1-Cdk1AF and its subsequent degradation in the absence of NEDB. The onset of CyclinB1-Cdk1AF degradation is indicated on the pseudo-colour (rainbow LUT) images. For each cell, the quantification of the FRET activity, the level of CyclinB1-Cdk1AF-mCherry and its nuclear accumulation are shown.
Comment in
- Cell cycle: Activities of a mitotic master.
Baumann K. Baumann K. Nat Rev Mol Cell Biol. 2010 Jun;11(6):389. doi: 10.1038/nrm2913. Nat Rev Mol Cell Biol. 2010. PMID: 20495580 No abstract available.
Similar articles
- Activation of cyclin B1-Cdk1 synchronizes events in the nucleus and the cytoplasm at mitosis.
Gavet O, Pines J. Gavet O, et al. J Cell Biol. 2010 Apr 19;189(2):247-59. doi: 10.1083/jcb.200909144. J Cell Biol. 2010. PMID: 20404109 Free PMC article. - PLK1 Activation in Late G2 Sets Up Commitment to Mitosis.
Gheghiani L, Loew D, Lombard B, Mansfeld J, Gavet O. Gheghiani L, et al. Cell Rep. 2017 Jun 6;19(10):2060-2073. doi: 10.1016/j.celrep.2017.05.031. Cell Rep. 2017. PMID: 28591578 - Cyclin B1-Cdk1 activation continues after centrosome separation to control mitotic progression.
Lindqvist A, van Zon W, Karlsson Rosenthal C, Wolthuis RM. Lindqvist A, et al. PLoS Biol. 2007 May;5(5):e123. doi: 10.1371/journal.pbio.0050123. PLoS Biol. 2007. PMID: 17472438 Free PMC article. - Two distinct controls of mitotic cdk1/cyclin B1 activity requisite for cell growth prior to cell division.
Miyazaki T, Arai S. Miyazaki T, et al. Cell Cycle. 2007 Jun 15;6(12):1419-25. Epub 2007 May 7. Cell Cycle. 2007. PMID: 17592253 Review. - Cyclin B1 and CDK1: nuclear localization and upstream regulators.
Porter LA, Donoghue DJ. Porter LA, et al. Prog Cell Cycle Res. 2003;5:335-47. Prog Cell Cycle Res. 2003. PMID: 14593728 Review.
Cited by
- Endosomolytic reducible polymeric electrolytes for cytosolic protein delivery.
Tian L, Kang HC, Bae YH. Tian L, et al. Biomacromolecules. 2013 Aug 12;14(8):2570-81. doi: 10.1021/bm400337f. Epub 2013 Jul 11. Biomacromolecules. 2013. PMID: 23841591 Free PMC article. - 3-cinnamoyl-4-hydroxy-6-methyl-2H-pyran-2-one (CHP) inhibits human ovarian cell proliferation by inducing apoptosis.
Lan QY, Liu QL, Cai J, Liu AW. Lan QY, et al. Int J Clin Exp Pathol. 2015 Jan 1;8(1):155-63. eCollection 2015. Int J Clin Exp Pathol. 2015. PMID: 25755702 Free PMC article. - Combined Inhibition of UBE2C and PLK1 Reduce Cell Proliferation and Arrest Cell Cycle by Affecting ACLY in Pan-Cancer.
Liang K, Wang Q, Qiu L, Gong X, Chen Z, Zhang H, Ding K, Liu Y, Wei J, Lin S, Fu S, Du H. Liang K, et al. Int J Mol Sci. 2023 Oct 27;24(21):15658. doi: 10.3390/ijms242115658. Int J Mol Sci. 2023. PMID: 37958642 Free PMC article. - CENPW knockdown inhibits progression of bladder cancer through inducing cell cycle arrest and apoptosis.
Zhang P, Yang Q, Chen X, Chen X, Wang Q, Chen K, An Y, Jiang K, Sun F. Zhang P, et al. J Cancer. 2024 Jan 1;15(3):858-870. doi: 10.7150/jca.90449. eCollection 2024. J Cancer. 2024. PMID: 38213721 Free PMC article. - Quantitative model of eukaryotic Cdk control through the Forkhead CONTROLLER.
Barberis M. Barberis M. NPJ Syst Biol Appl. 2021 Jun 11;7(1):28. doi: 10.1038/s41540-021-00187-5. NPJ Syst Biol Appl. 2021. PMID: 34117265 Free PMC article. Review.
References
- Abrieu A, Brassac T, Galas S, Fisher D, Labbe JC, Doree M. The polo-like kinase plx1 is a component of the MPF amplification loop at the G2/M-phase transition of the cell cycle in xenopus eggs. Journal of cell science. 1998;111:1751–1757. - PubMed
- Blangy A, Lane HA, d’Herin P, Harper M, Kress M, Nigg EA. Phosphorylation by p34cdc2 regulates spindle association of human Eg5, a kinesin-related motor essential for bipolar spindle formation in vivo. Cell. 1995;83:1159–1169. - PubMed
- Borgne A, Ostvold AC, Flament S, Meijer L. Intra-M Phase-promoting Factor Phosphorylation of CyclinB at the Prophase/Metaphase Transition. The Journal of biological chemistry. 1999;274:11977–11986. - PubMed
Publication types
MeSH terms
Substances
LinkOut - more resources
Full Text Sources
Other Literature Sources
Research Materials
Miscellaneous
