Action potential energy efficiency varies among neuron types in vertebrates and invertebrates - PubMed (original) (raw)
Action potential energy efficiency varies among neuron types in vertebrates and invertebrates
Biswa Sengupta et al. PLoS Comput Biol. 2010.
Abstract
The initiation and propagation of action potentials (APs) places high demands on the energetic resources of neural tissue. Each AP forces ATP-driven ion pumps to work harder to restore the ionic concentration gradients, thus consuming more energy. Here, we ask whether the ionic currents underlying the AP can be predicted theoretically from the principle of minimum energy consumption. A long-held supposition that APs are energetically wasteful, based on theoretical analysis of the squid giant axon AP, has recently been overturned by studies that measured the currents contributing to the AP in several mammalian neurons. In the single compartment models studied here, AP energy consumption varies greatly among vertebrate and invertebrate neurons, with several mammalian neuron models using close to the capacitive minimum of energy needed. Strikingly, energy consumption can increase by more than ten-fold simply by changing the overlap of the Na(+) and K(+) currents during the AP without changing the APs shape. As a consequence, the height and width of the AP are poor predictors of energy consumption. In the Hodgkin-Huxley model of the squid axon, optimizing the kinetics or number of Na(+) and K(+) channels can whittle down the number of ATP molecules needed for each AP by a factor of four. In contrast to the squid AP, the temporal profile of the currents underlying APs of some mammalian neurons are nearly perfectly matched to the optimized properties of ionic conductances so as to minimize the ATP cost.
Conflict of interest statement
The authors have declared that no competing interests exist.
Figures
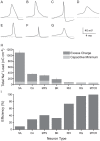
Figure 1. Action potential energy usage in seven neuron models from vertebrates and invertebrates.
(A) The shapes of action potentials in single compartment Hodgkin-Huxley type models from the squid giant axon (SA), (B) crab motor neuron axon (CA), (C) mouse fast-spiking neuron (MFS), (D) honeybee Kenyon cell (BK), (E) rat hippocampal interneuron (RHI), (F) rat granule cell (RG) and (G) mouse thalamo-cortical relay neuron (MTCR). The dashed grey line indicates the resting potential of each model. (H) The respective Na+ load (nC cm−2) of each action potential (dark grey) and the capacitive minimum Na+ load of each action potential (light grey). Error bars show the effect of changing the peak conductances of the voltage-gated ion channels by ±5% on AP energy consumption. (I) The efficiency of action potentials from each model. Error bars show the effect of changing the peak conductances of the voltage-gated ion channels by ±5% on AP energy efficiency.
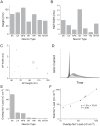
Figure 2. The overlap between Na+ and K+ currents affects action potential efficiency.
(A) The heights of action potentials in the seven models. Error bars show the effect on AP height of changing the peak conductances of the voltage-gated ion channels by ±5%. (B) The half widths of action potentials in the seven models. Error bars are not visible because changing the peak conductances of the voltage-gated ion channels by ±5% did not affect AP width. (C) The relationship between the height, width and Na+ load of action potentials from each of the models shown in Figure 1. The size of each circle is proportional to the energy consumed by the action potential. (D) Schematic diagram of the ionic charge distributions of an action potential depolarizing charge (horizontal lines), overlap charge (hatched) and hyperpolarizing charge (vertical lines). (E) The overlap charge in action potentials from each of the seven models. (F) The relationship between the overlap charge and the total Na+ load. SA, squid giant axon; CA, crab motor neuron; MFS, mouse fast spiking neuron; BK, honeybee Kenyon cell; RHI, rat hippocampal interneuron; RG, rat granule cell; MTCR, mouse thalamocortical relay neuron.
Figure 3. Scaling biophysical properties of voltage-gated ion channels influences action potential energy consumption.
(A) Scaling the conductance per unit area of Na+ (gNa) and K+ (gK) channels affects the Na+ load of the action potential of the squid giant axon (SA) model. (B) Scaling the inactivation (τh) time constant of the Na+ voltage-gated channel and the activation (τn) time constant of the K+ voltage-gated channel affects the Na+ load of the action potential of the squid giant axon (SA) model. (C) Scaling the conductance per unit area of Na+ (gNa) and K+ (gK) channels affects the Na+ load of the action potential of the rat hippocampal interneuron (RHI) model. (D) Scaling the inactivation (τh) time constant of the Na+ voltage-gated channel and the activation (τn) time constant of the K+ voltage-gated channel affects the Na+ load of the action potential of the rat hippocampal interneuron (RHI) model. Colors indicate the Na+ load of a single AP (nC cm−2). ‘+’ indicates the Na+ load of the original model.
Figure 4. The relationship between action potential height, width and energy consumption within a neuron model.
(A) The relationship between action potential height, width and Na+ load when the conductances of the Na+ and K+ voltage-gated channels are scaled in the squid giant axon (SA) model. In all the panels the size of the circle is proportional to the Na+ load of a single AP, larger circles indicating higher action potential Na+ load. (B) The relationship between action potential height, width and Na+ load when the time constants (τh, τn) of the Na+ and K+ voltage-gated channels are scaled in the squid giant axon (SA) model. (C) The relationship between action potential height, width and Na+ load when the conductances of the Na+ and K+ voltage-gated channels are scaled in the rat hippocampal interneuron (RHI) model. (D) The relationship between action potential height, width and Na+ load when the time constants (τh, τn) of the Na+ and K+ voltage-gated channels are scaled in the rat hippocampal interneuron (RHI) model.
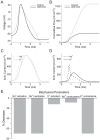
Figure 5. Constrained optimization of the Na+ load of the squid axon model produces energy efficient action potentials.
(A) The action potential waveform before (light grey) and after (black) optimization. (B) The cumulative Na+ load during the action potential before (light grey) and after (black) optimization. (C) The Na+ (light grey, dashed line) and K+ (light grey, solid line) currents generating the action potential in the original squid giant axon model. Note the extensive overlap between the Na+ and K+ currents. (D) The Na+ (black, dashed line) and K+ (black, solid line) currents generating the action potential in the optimized squid giant axon model. Note the reduced overlap between the Na+ and K+ currents. (E) The changes in each of the biophysical parameters included in our constrained optimization after optimization relative to the original parameter values.
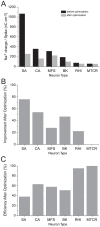
Figure 6. Constrained optimization reduces the energy consumption of action potentials in models of vertebrate and invertebrate neuron models.
(A) The Na+ load of action potentials in each of the six models before (black) and after (light grey) constrained optimization. (B) The same data as in A, replotted as the percentage improvement in the Na+ load of action potentials. (C) The energy efficiency of action potentials in each of the models after optimization. SA, squid giant axon; CA, crab motor neuron; MFS, mouse fast spiking neuron; BK, honeybee Kenyon cell; RHI, rat hippocampal interneuron; RG, rat granule cell; MTCR, mouse thalamocortical relay neuron.
Figure 7. Optimization produces changes in the biophysical properties of voltage-gated ion channels reducing action potential overlap load.
(A) Proportional changes in the biophysical parameters of voltage-gated ion channels in five of the models after optimization. Positive values indicate an increase and negative values indicate a decrease in the parameter relative to the original model. (B) The overlap load of each action potential before (black) and after (grey) optimization. (C) The relationship between the overlap load and the total Na+ load of action potentials before (black) and after (grey) optimization. SA, squid giant axon; CA, crab motor neuron; MFS, mouse fast spiking neuron; BK, honeybee Kenyon cell; RHI, rat hippocampal interneuron; RG, rat granule cell; MTCR, mouse thalamocortical relay neuron.
Figure 8. A revised energy budget for signaling in the grey matter of the rat brain.
Incorporating the increased efficiency of action potentials in mammalian neurons into Attwell and Laughlin's original energy budget for grey matter in the rat brain reduced the proportion of the energy budget consumed by action potentials. The proportion of the energy budget consumed by synaptic transmission is increased.
Similar articles
- Energy Cost of Action Potential Generation and Propagation in Thalamocortical Relay Neurons During Deep Brain Stimulation.
Yi G, Wang J, Wei X, Che Y. Yi G, et al. IEEE Trans Biomed Eng. 2019 Dec;66(12):3457-3471. doi: 10.1109/TBME.2019.2906114. Epub 2019 Mar 27. IEEE Trans Biomed Eng. 2019. PMID: 30932816 - A nerve model of greatly increased energy-efficiency and encoding flexibility over the Hodgkin-Huxley model.
Fohlmeister JF. Fohlmeister JF. Brain Res. 2009 Nov 3;1296:225-33. doi: 10.1016/j.brainres.2009.06.101. Epub 2009 Jul 9. Brain Res. 2009. PMID: 19596283 Free PMC article. - The determinants of the onset dynamics of action potentials in a computational model.
Baranauskas G, Mukovskiy A, Wolf F, Volgushev M. Baranauskas G, et al. Neuroscience. 2010 Jun 2;167(4):1070-90. doi: 10.1016/j.neuroscience.2010.02.072. Epub 2010 Mar 6. Neuroscience. 2010. PMID: 20211703 - The mammalian nodal action potential: new data bring new perspectives.
Tanner GR, Tzingounis AV. Tanner GR, et al. Adv Physiol Educ. 2022 Dec 1;46(4):693-702. doi: 10.1152/advan.00171.2021. Epub 2022 Sep 29. Adv Physiol Educ. 2022. PMID: 36173340 Review. - [Physiological Aspects of the Application of Hodgkin-Huxley Model of Action Potential Initiation for Invertebrate and Vertebrate Neurons].
Nikitin ES, Malyshev AY, Balaban PM, Volgushev MA. Nikitin ES, et al. Zh Vyssh Nerv Deiat Im I P Pavlova. 2016 May;66(3):279-288. Zh Vyssh Nerv Deiat Im I P Pavlova. 2016. PMID: 30695410 Review. Russian.
Cited by
- Dendrites contribute to the gradient of intrinsic timescales encompassing cortical and subcortical brain networks.
Wu K, Gollo LL. Wu K, et al. Front Cell Neurosci. 2024 Sep 6;18:1404605. doi: 10.3389/fncel.2024.1404605. eCollection 2024. Front Cell Neurosci. 2024. PMID: 39309702 Free PMC article. - Quantum Biology and the Potential Role of Entanglement and Tunneling in Non-Targeted Effects of Ionizing Radiation: A Review and Proposed Model.
Matarèse BFE, Rusin A, Seymour C, Mothersill C. Matarèse BFE, et al. Int J Mol Sci. 2023 Nov 17;24(22):16464. doi: 10.3390/ijms242216464. Int J Mol Sci. 2023. PMID: 38003655 Free PMC article. Review. - Metabolically regulated spiking could serve neuronal energy homeostasis and protect from reactive oxygen species.
Chintaluri C, Vogels TP. Chintaluri C, et al. Proc Natl Acad Sci U S A. 2023 Nov 28;120(48):e2306525120. doi: 10.1073/pnas.2306525120. Epub 2023 Nov 21. Proc Natl Acad Sci U S A. 2023. PMID: 37988463 Free PMC article. - A functional account of stimulation-based aerobic glycolysis and its role in interpreting BOLD signal intensity increases in neuroimaging experiments.
Theriault JE, Shaffer C, Dienel GA, Sander CY, Hooker JM, Dickerson BC, Barrett LF, Quigley KS. Theriault JE, et al. Neurosci Biobehav Rev. 2023 Oct;153:105373. doi: 10.1016/j.neubiorev.2023.105373. Epub 2023 Aug 25. Neurosci Biobehav Rev. 2023. PMID: 37634556 Free PMC article. Review. - Homeostatic regulation of neuronal function: importance of degeneracy and pleiotropy.
Yang J, Prescott SA. Yang J, et al. Front Cell Neurosci. 2023 Jun 2;17:1184563. doi: 10.3389/fncel.2023.1184563. eCollection 2023. Front Cell Neurosci. 2023. PMID: 37333893 Free PMC article. Review.
References
- Attwell D, Laughlin SB. An energy budget for signaling in the grey matter of the brain. J Cereb Blood Flow Metab. 2001;21:1133–1145. - PubMed
- Clarke JB, Sokoloff L. Circulation and energy metabolism of the brain. In: Siegel GJ, Agranoff BW, Albers RW, Fisher SK, Uhler MD, editors. Basic Neurochemistry, 6th Ed. Philadelphia: Lippincott-Raven; 1999. pp. 637–669.
- Skou JC. The influence of some cations on an adenosine triphosphatase from peripheral nerves. Biochim Biophys Acta. 1957;23:394–401. - PubMed
- Crotty P, Sangrey T, Levy WB. Metabolic energy cost of action potential velocity. J Neurophysiol. 2006;96:1237–1246. - PubMed
- Hodgkin A. The optimum density of sodium channels in an unmyelinated nerve. . Philos Trans R Soc Lond B Biol Sci. 1975;270:297–300. - PubMed
Publication types
MeSH terms
Substances
LinkOut - more resources
Full Text Sources
Research Materials
Miscellaneous


