Analysis of TSC cortical tubers by deep sequencing of TSC1, TSC2 and KRAS demonstrates that small second-hit mutations in these genes are rare events - PubMed (original) (raw)
Analysis of TSC cortical tubers by deep sequencing of TSC1, TSC2 and KRAS demonstrates that small second-hit mutations in these genes are rare events
Wei Qin et al. Brain Pathol. 2010 Nov.
Abstract
Tuberous sclerosis complex (TSC) is an often severe neurocutaneous syndrome. Cortical tubers are the predominant neuropathological finding in TSC, and their number and location has been shown to correlate roughly with the severity of neurologic features in TSC. Past studies have shown that genomic deletion events in TSC1 or TSC2 are very rare in tubers, and suggested the potential involvement of the MAPK pathway in their pathogenesis. We used deep sequencing to assess all coding exons of TSC1 and TSC2, and the activating mutation hot spots within KRAS in 46 tubers from TSC patients. Germline heterozygous mutations were identified in 81% of tubers. The same secondary mutation in TSC2 was identified in six tuber samples from one individual. Further study showed that this second hit mutation was widely distributed in the cortex from one cerebral hemisphere of this individual at frequencies up to 10%. No other secondary mutations were found in the other 40 tubers analyzed. These data indicate that small second hit mutations in any of these three genes are very rare in TSC tubers. However, in one TSC individual, a second hit TSC2 point mutation occurred early during brain development, and likely contributed to tuber formation.
© 2010 The Authors; Brain Pathology © 2010 International Society of Neuropathology.
Figures
Figure 1
Tuber pathology and phospho‐S6 expression. H/E and phospho‐S6(S235–236) IHC is shown for two resected tubers, one with relatively few giant cells (“low %”), and the other with relatively large numbers (“high %”).
Figure 2
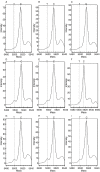
Mass spectrometry analysis of T allele frequency in control and brain samples. Mass spectrometry spectra are shown from single base extension sequencing on the Sequenom platform for the TSC2 1864C>T variant. The expected elution peak sizes for the T and C alleles are shown by the dotted lines. (A–C) Control DNA samples. (D–F) DNA samples from three of the seven brain tuber samples initially analyzed by deep sequencing. (G–I) DNA samples from three of the 20 brain samples in the replication analysis. Note that the C peak predominates in all samples; there is a clear strong peak for the variant T nucleotide in samples D, E, G, H and I. Weaker signals are seen in samples C and F, whereas no signal is seen in samples A or B.
Figure 3
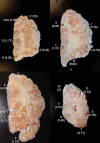
Map of frozen brain sections and T allele frequencies for the TSC2 1864C>T variant. Cortical sections proceed from anterior to posterior. Letters indicate sites of sampling and corresponding T allele frequencies as determined by mass spectrometry. In many regions, T allele frequency is very low/negligible, whereas in regions AA, H, K, J, B, M and E it is much higher than controls. At the anatomical level, there is no clear correlation between the spatial location of the brain sampled, and T allele frequency.
Figure 4
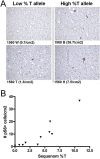
Correlation between detection of pS6(S240/244) positive cells and %T allele as determined by mass spectrometry. (A) Representative images of pS6 immunohistochemical staining of tissue from areas of lower %T allele and higher %T allele; sample names and pS6‐positive cells/cm2 shown. Note the increased number of pS6 positive cells and the abnormal morphology of the positive cells on the right. (B) Correlation of %T allele by Sequenom mass spectrometry analysis, and the number of pS6‐positive cells per cm2 in 10 brain samples.
Figure 5
Functional analysis of TSC2 protein with the R622W mutation. (A) FLAG‐TSC2 was immunoprecipitated with anti‐FLAG antibody from HEK293E cells in which both FLAG‐TSC2 and TSC1 were transfected. Note lack of co‐precipitation of TSC1 in the cells expressing the TSC2‐R622W variant. (B) Analysis of T389 phosphorylation of S6K in HEK 293T cells transfected to express TSC1, HA‐tagged S6K and TSC2 (wt) or TSC2‐R622W. Note that pS6K‐T389 levels are significantly higher in cells expressing the variant TSC2 in comparison with wild‐type TSC2.
Similar articles
- Biallelic TSC gene inactivation in tuberous sclerosis complex.
Crino PB, Aronica E, Baltuch G, Nathanson KL. Crino PB, et al. Neurology. 2010 May 25;74(21):1716-23. doi: 10.1212/WNL.0b013e3181e04325. Neurology. 2010. PMID: 20498439 Free PMC article. - Mutational analysis in a cohort of 224 tuberous sclerosis patients indicates increased severity of TSC2, compared with TSC1, disease in multiple organs.
Dabora SL, Jozwiak S, Franz DN, Roberts PS, Nieto A, Chung J, Choy YS, Reeve MP, Thiele E, Egelhoff JC, Kasprzyk-Obara J, Domanska-Pakiela D, Kwiatkowski DJ. Dabora SL, et al. Am J Hum Genet. 2001 Jan;68(1):64-80. doi: 10.1086/316951. Epub 2000 Dec 8. Am J Hum Genet. 2001. PMID: 11112665 Free PMC article. - Sun exposure causes somatic second-hit mutations and angiofibroma development in tuberous sclerosis complex.
Tyburczy ME, Wang JA, Li S, Thangapazham R, Chekaluk Y, Moss J, Kwiatkowski DJ, Darling TN. Tyburczy ME, et al. Hum Mol Genet. 2014 Apr 15;23(8):2023-9. doi: 10.1093/hmg/ddt597. Epub 2013 Nov 23. Hum Mol Genet. 2014. PMID: 24271014 Free PMC article. - Tuberous sclerosis as an underlying basis for infantile spasm.
Yeung RS. Yeung RS. Int Rev Neurobiol. 2002;49:315-32. doi: 10.1016/s0074-7742(02)49019-8. Int Rev Neurobiol. 2002. PMID: 12040899 Review. - Identification of TSC2 mosaic mutation limited to cortical tuber with TSC targeted sequencing: a case report and literature review.
Zhou Y, Wang X, Wang J, Ding Y, Wang Y, Li H, Zhao R, Wu B. Zhou Y, et al. Childs Nerv Syst. 2021 Dec;37(12):3945-3949. doi: 10.1007/s00381-021-05059-1. Epub 2021 Jan 30. Childs Nerv Syst. 2021. PMID: 33517515 Review.
Cited by
- Effect of Postmortem Interval and Years in Storage on RNA Quality of Tissue at a Repository of the NIH NeuroBioBank.
White K, Yang P, Li L, Farshori A, Medina AE, Zielke HR. White K, et al. Biopreserv Biobank. 2018 Apr;16(2):148-157. doi: 10.1089/bio.2017.0099. Epub 2018 Mar 2. Biopreserv Biobank. 2018. PMID: 29498539 Free PMC article. - Mechanisms of neurocognitive dysfunction and therapeutic considerations in tuberous sclerosis complex.
Tsai P, Sahin M. Tsai P, et al. Curr Opin Neurol. 2011 Apr;24(2):106-13. doi: 10.1097/WCO.0b013e32834451c4. Curr Opin Neurol. 2011. PMID: 21301339 Free PMC article. Review. - Graded loss of tuberin in an allelic series of brain models of TSC correlates with survival, and biochemical, histological and behavioral features.
Yuan E, Tsai PT, Greene-Colozzi E, Sahin M, Kwiatkowski DJ, Malinowska IA. Yuan E, et al. Hum Mol Genet. 2012 Oct 1;21(19):4286-300. doi: 10.1093/hmg/dds262. Epub 2012 Jun 29. Hum Mol Genet. 2012. PMID: 22752306 Free PMC article. - Novel Histopathological Patterns in Cortical Tubers of Epilepsy Surgery Patients with Tuberous Sclerosis Complex.
Mühlebner A, van Scheppingen J, Hulshof HM, Scholl T, Iyer AM, Anink JJ, van den Ouweland AM, Nellist MD, Jansen FE, Spliet WG, Krsek P, Benova B, Zamecnik J, Crino PB, Prayer D, Czech T, Wöhrer A, Rahimi J, Höftberger R, Hainfellner JA, Feucht M, Aronica E. Mühlebner A, et al. PLoS One. 2016 Jun 13;11(6):e0157396. doi: 10.1371/journal.pone.0157396. eCollection 2016. PLoS One. 2016. PMID: 27295297 Free PMC article. - Pattern of TSC1 and TSC2 germline mutations in Russian patients with tuberous sclerosis.
Suspitsin EN, Yanus GA, Dorofeeva MY, Ledashcheva TA, Nikitina NV, Buyanova GV, Saifullina EV, Sokolenko AP, Imyanitov EN. Suspitsin EN, et al. J Hum Genet. 2018 May;63(5):597-604. doi: 10.1038/s10038-018-0416-0. Epub 2018 Feb 23. J Hum Genet. 2018. PMID: 29476190
References
- Au KS, Williams AT, Roach ES, Batchelor L, Sparagana SP, Delgado MR et al. (2007) Genotype/phenotype correlation in 325 individuals referred for a diagnosis of tuberous sclerosis complex in the United States. Genet Med 9:88–100. - PubMed
- Boer K, Jansen F, Nellist M, Redeker S, Van Den Ouweland AM, Spliet WG et al. (2008) Inflammatory processes in cortical tubers and subependymal giant cell tumors of tuberous sclerosis complex. Epilepsy Res 78:7–21. - PubMed
Publication types
MeSH terms
Substances
Grants and funding
- P01 NS024279/NS/NINDS NIH HHS/United States
- R01 NS031535/NS/NINDS NIH HHS/United States
- R01 NS3899/NS/NINDS NIH HHS/United States
- 1P01NS24279/NS/NINDS NIH HHS/United States
LinkOut - more resources
Full Text Sources
Other Literature Sources
Medical
Miscellaneous


