mDia1 targets v-Src to the cell periphery and facilitates cell transformation, tumorigenesis, and invasion - PubMed (original) (raw)
mDia1 targets v-Src to the cell periphery and facilitates cell transformation, tumorigenesis, and invasion
Masahiro Tanji et al. Mol Cell Biol. 2010 Oct.
Abstract
The small GTPase Rho regulates cell morphogenesis through remodeling of the actin cytoskeleton. While Rho is overexpressed in many clinical cancers, the role of Rho signaling in oncogenesis remains unknown. mDia1 is a Rho effector producing straight actin filaments. Here we transduced mouse embryonic fibroblasts from mDia1-deficient mice with temperature-sensitive v-Src and examined the involvement and mechanism of the Rho-mDia1 pathway in Src-induced oncogenesis. We showed that in v-Src-transduced mDia1-deficient cells, formation of actin filaments is suppressed, and v-Src in the perinuclear region does not move to focal adhesions upon a temperature shift. Consequently, membrane translocation of v-Src, v-Src-induced morphological transformation, and podosome formation are all suppressed in mDia1-deficient cells with impaired tyrosine phosphorylation. mDia1-deficient cells show reduced transformation in vitro as examined by focus formation and colony formation in soft agar and exhibit suppressed tumorigenesis and invasion when implanted in nude mice in vivo. Given overexpression of c-Src in various cancers, these findings suggest that Rho-mDia1 signaling facilitates malignant transformation and invasion by manipulating the actin cytoskeleton and targeting Src to the cell periphery.
Figures
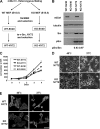
FIG. 1.
mDia1 deficiency impairs v-Src-induced morphological transformation. (A) Generation of WT-NY72 and KO-NY72 cell populations. MEFs from WT and mDia1−/− (KO) littermates were immortalized with SV40 T antigen and then infected with retrovirus harboring ts-v-Src, NY72. Populations of cells stably expressing SV40 T antigen and NY72 were isolated by two-step drug selection. (B) Expression and activation of v-Src in WT-SV40, KO-SV40, WT-NY72, and KO-NY72 cells. The cells were maintained at 37°C. Cell lysates were prepared and probed for α-tubulin, mDia1, Src, and pY416-Src. Ratios of the densities of pSrc to Src bands are shown below the image. (C) Proliferation of WT-SV40, KO-SV40, WT-NY72, and KO-NY72 cells. Cells were seeded and cultured at 37°C in a 35-mm dish in DMEM containing 10% FBS and harvested at indicated times for cell counting. Means ± SEM of data from three independent experiments is shown. (D) v-Src-induced morphological changes in WT-NY72 and KO-NY72 cells. WT-NY72 and KO-NY72 cells were grown at either 40°C or 37°C and observed under phase-contrast microscopy. (E) Actin cytoskeleton in WT-NY72 and KO-NY72 cells. WT-NY72 and KO-NY72 cells were grown at either 40°C or 37°C, fixed, and stained with Oregon green-phalloidin. Bars in panels D and E, 50 μm.
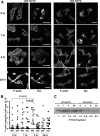
FIG. 2.
mDia1 deficiency impairs formation of actin fibers and peripheral targeting of v-Src upon temperature shift. (A) Time course of formation of actin fibers and v-Src translocation after temperature shift. WT-NY72 and KO-NY72 cells grown at the nonpermissive temperature were shifted to the permissive temperature and maintained for 0, 1, 4, and 24 h. The cells were fixed and stained with an antibody against Src and Texas Red X-phalloidin. A merged image of the two populations of cells 4 h after the temperature shift is shown in the figure in the supplemental material. Bar, 50 μm. (B) Quantification of F-actin intensity. WT-NY72 and KO-NY72 cells were cultured for 0, 1, 4, and 24 h after the temperature shift and stained for F-actin with Texas Red X-phalloidin. The fluorescence density, i.e., the intensity divided by cell area, of each cell was quantified and is shown (n = 20 each). (C) Accumulation of v-Src in the P100 fraction. WT-NY72 and KO-NY72 cells were shifted to the permissive temperature and harvested at indicated times. The P100 fraction was prepared from each population and subjected to Western blotting for Src. v-Src signal was detected 5 kDa below the molecular mass of c-Src. The c-Src signals were not visible under the present blotting conditions. The density of each band is shown below the blot.
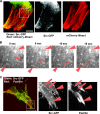
FIG. 3.
Time-lapse video microscopy of Src-GFP in XTC cells transfected with mDia1ΔN3. (A) Coimaging of mCherry-lifeact and Src-GFP. XTC cells expressing mDia1ΔN3 were identified as cells showing parallel actin fibers, and Src-GFP and mCherry-lifeact signals were monitored. A still image is shown. Bar, 5 μm. (B) Tube extension and fusion of Src-GFP signals. Src signals boxed in panel A were video monitored at 400 ms per frame at the interval of 5 s. Arrows show Src-GFP moving along actin stress fibers. Arrowheads show Src in vesicular structures. (C) Colocalization of Src-GFP and signals for paxillin. XTC cells expressing Src-GFP and mDia1ΔN3 were fixed and stained for paxillin (red). Arrowheads indicate matured focal adhesions, and arrows indicate colocalization of paxillin and Src. Bar, 20 μm.
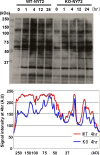
FIG. 4.
Impaired v-Src-mediated tyrosine phosphorylation in KO-NY72 cells. WT-NY72 and KO-NY72 cells were shifted to the permissive temperature and collected at the indicated times. Cell lysates were prepared and subjected to immunoblotting with an antiphosphotyrosine antibody. The intensity of the phosphotyrosine signal in the lysates of WT-NY72 and KO-NY72 cells at 4 h after the temperature shift was determined by densitometry and is shown below.
FIG. 5.
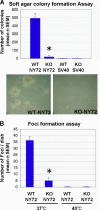
Impaired transformation in vitro of KO-NY72 cells. (A) Soft agar colony formation. WT-SV40, KO-SV40, WT-NY72, and KO-NY72 cells were cultured in 0.36% agarose for 2 weeks until colonies of WT-NY72 cells became visible. Colonies were stained with MTT, and the number of colonies in each dish was determined. The experiment was performed in triplicate independently three times. Shown are representative photomicrographs of WT-NY72 and KO-NY72 cells at the time of quantification. Results are means ± SEM of data from three experiments. (B) Focus formation. WT-NY72 and KO-NY72 cells were plated at subconfluence in 60-mm dishes and cultured for 1 week at 37°C and 40°C. Foci were stained with Giemsa solution, and the number was determined. Means ± SEM of three independent experiments are shown.
FIG. 6.
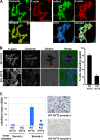
Impaired invasion in vitro of KO-NY72 cells. (A) Colocalization of mDia1 and pSrc in podosomes. WT-NY72 cells were shifted to the permissive temperature for 24 h, fixed, and stained either for pSrc, F-actin, and mDia1 or for cortactin and F-actin. Bar, 50 μm on the left and 20 μm on the right. (B) In situ zymography of WT-NY72 and KO-NY72 cells. WT-NY72 and KO-NY72 cells maintained at 40°C were plated on Oregon green 488-conjugated gelatin cross-linked glass coverslips and cultured at 37°C for 3 h. Cells were fixed and stained for actin and cortactin, and cells degrading fluorescent gelatin were counted. (C) Invasion in Matrigel. WT-NY72 and KO-NY72 cells were applied to the upper well of the Matrigel invasion chamber with or without serum in the lower well. After 24 h, Matrigel was removed and cells that passed through Matrigel and penetrated the membrane were stained and their number determined. The numbers of invading cells are shown as means ± SEM from three independent assays. Typical photomicrographs are shown on the right.
FIG. 7.
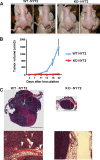
mDia1-deficient cells are impaired in tumorigenesis and invasion in vivo. (A) Tumor formation in nude mice. Nude mice underwent subcutaneous injection of either WT-NY72 cells or KO-NY72 cells (3 × 10⁵ per site) in the flank, three mice per group and two sites per mouse. Nineteen days after inoculation, tumor formation at the injected sites was photographed. Inoculation of KO-NY72 cells developed no or very small tumors compared to those from WT-NY72 cells (arrowheads). (B) Time course of tumor development. WT-NY72 and KO-NY72 cells were injected into nude mice as described above, and the tumor volumes were measured as described in Materials and Methods. Each point represents a mean ± SEM (n = 6). (C) Histological analysis. Tumors from WT-NY72 and KO-NY72 cells were taken at day 22 after inoculation, sectioned, and stained with hematoxylin and eosin. Photomicrographs of a representative tumor from WT-NY72 cells and a sole tumor formed from six injections of KO-NY72 cells are shown. Boxed areas are magnified below. Note that the tumor from WT-NY72 cells expands to both sides of the muscle layer (arrowheads). Bar, 5 mm.
Similar articles
- Differential effect of the focal adhesion kinase Y397F mutant on v-Src-stimulated cell invasion and tumor growth.
Chang LC, Huang CH, Cheng CH, Chen BH, Chen HC. Chang LC, et al. J Biomed Sci. 2005;12(4):571-85. doi: 10.1007/s11373-005-7212-5. Epub 2005 Nov 10. J Biomed Sci. 2005. PMID: 16132110 - Regulation of p190 Rho-GAP by v-Src is linked to cytoskeletal disruption during transformation.
Fincham VJ, Chudleigh A, Frame MC. Fincham VJ, et al. J Cell Sci. 1999 Mar;112 ( Pt 6):947-56. doi: 10.1242/jcs.112.6.947. J Cell Sci. 1999. PMID: 10036244 - The Rho-mDia1 pathway regulates cell polarity and focal adhesion turnover in migrating cells through mobilizing Apc and c-Src.
Yamana N, Arakawa Y, Nishino T, Kurokawa K, Tanji M, Itoh RE, Monypenny J, Ishizaki T, Bito H, Nozaki K, Hashimoto N, Matsuda M, Narumiya S. Yamana N, et al. Mol Cell Biol. 2006 Sep;26(18):6844-58. doi: 10.1128/MCB.00283-06. Mol Cell Biol. 2006. PMID: 16943426 Free PMC article. - Rho signaling, ROCK and mDia1, in transformation, metastasis and invasion.
Narumiya S, Tanji M, Ishizaki T. Narumiya S, et al. Cancer Metastasis Rev. 2009 Jun;28(1-2):65-76. doi: 10.1007/s10555-008-9170-7. Cancer Metastasis Rev. 2009. PMID: 19160018 Review. - Cytoskeletal targets for oncogenic tyrosine kinases.
Kellie S, Horvath AR, Elmore MA. Kellie S, et al. J Cell Sci. 1991 Jun;99 ( Pt 2):207-11. doi: 10.1242/jcs.99.2.207. J Cell Sci. 1991. PMID: 1653253 Review. No abstract available.
Cited by
- Transactivation of RAGE mediates angiotensin-induced inflammation and atherogenesis.
Pickering RJ, Tikellis C, Rosado CJ, Tsorotes D, Dimitropoulos A, Smith M, Huet O, Seeber RM, Abhayawardana R, Johnstone EK, Golledge J, Wang Y, Jandeleit-Dahm KA, Cooper ME, Pfleger KD, Thomas MC. Pickering RJ, et al. J Clin Invest. 2019 Jan 2;129(1):406-421. doi: 10.1172/JCI99987. Epub 2018 Dec 10. J Clin Invest. 2019. PMID: 30530993 Free PMC article. - Enteropathogenic E. coli relies on collaboration between the formin mDia1 and the Arp2/3 complex for actin pedestal biogenesis and maintenance.
Velle KB, Campellone KG. Velle KB, et al. PLoS Pathog. 2018 Dec 14;14(12):e1007485. doi: 10.1371/journal.ppat.1007485. eCollection 2018 Dec. PLoS Pathog. 2018. PMID: 30550556 Free PMC article. - Rho GTPases modulate malignant transformation of tumor cells.
Orgaz JL, Herraiz C, Sanz-Moreno V. Orgaz JL, et al. Small GTPases. 2014;5:e29019. doi: 10.4161/sgtp.29019. Epub 2014 May 8. Small GTPases. 2014. PMID: 25036871 Free PMC article. Review. - Roles of rho GTPases in intracellular transport and cellular transformation.
Chi X, Wang S, Huang Y, Stamnes M, Chen JL. Chi X, et al. Int J Mol Sci. 2013 Mar 28;14(4):7089-108. doi: 10.3390/ijms14047089. Int J Mol Sci. 2013. PMID: 23538840 Free PMC article. Review. - Spatial cycles mediated by UNC119 solubilisation maintain Src family kinases plasma membrane localisation.
Konitsiotis AD, Roßmannek L, Stanoev A, Schmick M, Bastiaens PIH. Konitsiotis AD, et al. Nat Commun. 2017 Jul 24;8(1):114. doi: 10.1038/s41467-017-00116-3. Nat Commun. 2017. PMID: 28740133 Free PMC article.
References
- Burridge, K., and K. Wennerberg. 2004. Rho and Rac take center stage. Cell 116:167-179. - PubMed
- Clark, E. A., T. R. Golub, E. S. Lander, and R. O. Hynes. 2000. Genomic analysis of metastasis reveals an essential role for RhoC. Nature 406:532-535. - PubMed
Publication types
MeSH terms
Substances
LinkOut - more resources
Full Text Sources
Other Literature Sources
Molecular Biology Databases
Miscellaneous
