Coordination between cell cycle progression and cell fate decision by the p53 and E2F1 pathways in response to DNA damage - PubMed (original) (raw)
Coordination between cell cycle progression and cell fate decision by the p53 and E2F1 pathways in response to DNA damage
Xiao-Peng Zhang et al. J Biol Chem. 2010.
Abstract
After DNA damage, cells must decide between different fates including growth arrest, DNA repair, and apoptosis. Both p53 and E2F1 are transcription factors involved in the decision process. However, the mechanism for cross-talk between the p53 and E2F1 pathways still remains unclear. Here, we proposed a four-module kinetic model of the decision process and explored the interplay between these two pathways in response to ionizing radiation via computer simulation. In our model the levels of p53 and E2F1 separately exhibit pulsatile and switching behaviors. Upon DNA damage, p53 is first activated, whereas E2F1 is inactivated, leading to cell cycle arrest in the G(1) phase. We found that the ultimate decision between cell life and death is determined by the number of p53 pulses depending on the extent of DNA damage. For repairable DNA damage, the cell can survive and reenter the S phase because of the activation of E2F1 and inactivation of p53. For irreparable DNA damage, growth arrest is overcome by growth factors, and activated p53 and E2F1 cooperate to initiate apoptosis. We showed that E2F1 promotes apoptosis by up-regulating the proapoptotic cofactors of p53 and procaspases. It was also revealed that deregulated E2F1 by oncogene activation can make cells sensitive to DNA damage even in low serum medium. Our model consistently recapitulates the experimental observations of the intricate relationship between p53 and E2F1 in the DNA damage response. This work underscores the significance of E2F1 in p53-mediated cell fate decision and may provide clues to cancer therapy.
Figures
FIGURE 1.
Schematic depiction of the integrated model. The model is composed of four modules: DNA repair, ATM sensor, p53 pulse generator, and cell fate decision modules. The model characterizes the whole process from the generation of DNA damage to the choice of cell fate. In the cell fate decision module, p53 and E2F1 coordinate to regulate expression of target genes, controlling cell cycle progression and cell fate.
FIGURE 2.
p53 pulse generator model. There exist three feedback loops: the negative feedback loop between p53 and Mdm2 (red and purple), the positive feedback loop involving p53, Akt, and Mdm2 (blue and purple), and the negative feedback loop between ATM and p53 via Wip1 (green).
FIGURE 3.
Cell fate decision module model. Active p53 is divided into p53 arrester and p53 killer. p53 arrester is a primarily phosphorylated form of p53 on Ser-15 and Ser-20, whereas p53 killer is a further phosphorylated form of p53 on Ser-46. p53 arrester induces cell cycle arrest in the G1 phase by inducing p21, which inhibits E2F1 activity, whereas p53 killer induces expression of proapoptotic genes. The conversion between p53 arrester and p53 killer is controlled by Wip1 and p53DINP1. E2F1 can be activated by growth factors. p53 killer and E2F1 cooperate to transactivate p53DINP1. With the help of E2F1-induced ASPP, p53 killer induces expression of p53AIP1 and Bax, which results in mitochondrial outer membrane permeabilization (MOMP). Moreover, E2F1 promotes apoptosis by up-regulating several key proapoptotic factors including Apaf-1 and procaspase-9 and -3.
FIGURE 4.
Overview of signal transduction in the model network. Shown is temporal evolution of the output of each module at the IR dose of 3 Gy (A) or 5 Gy (B). Upon IR, a number of DSBCs are produced, and ATM and p53 are activated. Consequently, the cell cycle is arrested in the G1 phase. With repairable DNA damage, only few pulses occur in ATM* and p53* levels before cells recover to normal proliferation, which is driven by activated E2F1. With irreparable DNA damage, ATM* is maintained at high levels after four pulses, whereas p53 level shows pulses in both phases. Activated E2F1 cooperates with p53 to activate caspase 3 and apoptosis ensues.
FIGURE 5.
ATM dynamics with two phases. A, shown is a bifurcation diagram of ATM* level versus the number of DSBCs, _n_C. ATM is activated if _n_C > 4 and inactivated if _n_C < 2. B, bifurcation (gray) and phase (black) diagrams of ATM* level versus Wip1 level. The ATM* level either shows pulses or behaves as a switch, depending on Wip1 levels. C, shown are time courses of ATM* (black) and Wip1 (gray) levels for three individual cells at _D_IR = 5 Gy. Due to stochasticity in the generation and repair of DNA damage, there exists remarkable variability in cellular responses.
FIGURE 6.
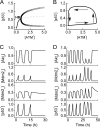
p53 pulses. A, shown is a bifurcation diagram of [p53*] versus [ATM*]. There is a Hopf bifurcation (HB). If [ATM*] is limited in a region between 2.9 and 4.8, the p53* level oscillates between the maximum and minimum of the limit cycle (open circle). B, shown is a phase diagram of [p53*] versus [ATM*]. When ATM is inhibited by Wip1, it switches between low and high levels; accordingly, the p53 level also undergoes oscillations. Displayed are time courses of [Aktp], [Mdm2c], [Mdm2n], and [p53*] at _D_IR = 3 (C) or 5 Gy (D).
FIGURE 7.
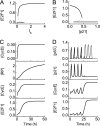
Cell cycle arrest and reentry into S phase. Shown is a bifurcation diagram of [E2F1] versus the concentration of serum, _I_S, (A) or [p21] (B). C, shown are time courses of [CycD], [RP], [CycE], and [E2F1] at the G1/S transition in unstressed cells with _I_S = 10. D, shown are time courses of [p53 arrester] (black) and [p53 killer] (gray), [p21], [CycE], and [E2F1] in stressed cells with _I_S = 10 and _D_IR = 5 Gy.
FIGURE 8.
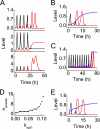
Conversion from p53 arrester to p53 killer after DNA damage. _k_sp21 is the p53-inducible synthesis rate of p21, and _k_re is the association constant between E2F1 and Rb. A, displayed is the conversion in the normal case (with _k_sp21 = 0.07 and _k_re = 2) at _D_IR = 5 Gy. Displayed are time courses of [p53 arrester] (black) and [p53 killer] (red) (top panel), [p21] (black) and [E2F1] (red) (middle panel), [Wip1] (black) and [p53DINP1] (red) (bottom panel). B, shown are time courses of [p53 arrester] (black), [p53 killer] (red), and [E2F1] (blue) with _k_sp21 = 0 and _D_IR = 2 Gy. C, the same conventions is used as in panel B with _k_sp21 = 0.1 and _D_IR = 12 Gy. D, shown is the number of p53 arrester pulses required for producing one pulse of p53 killer, _n_arrester, as a function of _k_sp21. E, the same convention is used as in panel B with _k_re = 0.1, _I_S = 0.4 and _D_IR = 2 Gy.
FIGURE 9.
Cooperation between p53 killer and E2F1 in apoptosis induction at _D_IR = 5 Gy. A, shown is the dynamic process of apoptosis induction by p53 killer and E2F1. Shown are time courses of [p53 killer] (black), [E2F1] (red), and [ASPP] (blue) (first panel), [Bax] (black) and [p53AIP1] (red) (second panel), [procasp9] (blue), [Apaf-1] (red), [Procasp3] (green), and [CytoC] (black) (third panel), and [Apops] (black), [Casp9] (red), and [Casp3] (blue) (fourth panel) (from top to bottom). B, shown are time courses of [Bax] (black), [p53AIP1] (red), [CytoC] (green), and [Casp3] (blue) in ASPP-deficient cells with _k_saspp2 = 0. C, shown are time courses of [CytoC] (black), [Casp9] (red), and [Casp3] (blue) in Procasp9-deficient cells with _k_scasp92 = 0.
FIGURE 10.
Fraction of apoptotic cells within a population of 2000 cells, _F_A, _versus D_IR. A, shown are curves for cases with different synthesis rate of p21: _k_sp21 = 0.07 (rectangle), 0 (circle), or 0.1 (triangle). B, shown are curves for cases with different association constant between Rb and E2F1: _k_sp21 = 2 and _I_S = 10 (normal case, rectangle) or _k_re = 0.1 and _I_S = 0.4 (with E1A activation, triangle).
Similar articles
- Dynamic analysis of the combinatorial regulation involving transcription factors and microRNAs in cell fate decisions.
Yan F, Liu H, Liu Z. Yan F, et al. Biochim Biophys Acta. 2014 Jan;1844(1 Pt B):248-57. doi: 10.1016/j.bbapap.2013.06.022. Epub 2013 Jul 8. Biochim Biophys Acta. 2014. PMID: 23845991 - E2F1-dependent pathways are involved in amonafide analogue 7-d-induced DNA damage, G2/M arrest, and apoptosis in p53-deficient K562 cells.
Li Y, Shao J, Shen K, Xu Y, Liu J, Qian X. Li Y, et al. J Cell Biochem. 2012 Oct;113(10):3165-77. doi: 10.1002/jcb.24194. J Cell Biochem. 2012. PMID: 22593008 - E2F1 induces MRN foci formation and a cell cycle checkpoint response in human fibroblasts.
Frame FM, Rogoff HA, Pickering MT, Cress WD, Kowalik TF. Frame FM, et al. Oncogene. 2006 Jun 1;25(23):3258-66. doi: 10.1038/sj.onc.1209352. Epub 2006 Jan 23. Oncogene. 2006. PMID: 16434972 - [Cell cycle regulation after exposure to ionizing radiation].
Teyssier F, Bay JO, Dionet C, Verrelle P. Teyssier F, et al. Bull Cancer. 1999 Apr;86(4):345-57. Bull Cancer. 1999. PMID: 10341340 Review. French. - Translating DNA damage into cancer cell death-A roadmap for E2F1 apoptotic signalling and opportunities for new drug combinations to overcome chemoresistance.
Engelmann D, Pützer BM. Engelmann D, et al. Drug Resist Updat. 2010 Aug-Oct;13(4-5):119-31. doi: 10.1016/j.drup.2010.06.001. Epub 2010 Aug 1. Drug Resist Updat. 2010. PMID: 20675184 Review.
Cited by
- Helping the Released Guardian: Drug Combinations for Supporting the Anticancer Activity of HDM2 (MDM2) Antagonists.
Kocik J, Machula M, Wisniewska A, Surmiak E, Holak TA, Skalniak L. Kocik J, et al. Cancers (Basel). 2019 Jul 19;11(7):1014. doi: 10.3390/cancers11071014. Cancers (Basel). 2019. PMID: 31331108 Free PMC article. Review. - Model scenarios for cell cycle re-entry in Alzheimer's disease.
Pandey N, Vinod PK. Pandey N, et al. iScience. 2022 Jun 7;25(7):104543. doi: 10.1016/j.isci.2022.104543. eCollection 2022 Jul 15. iScience. 2022. PMID: 35747391 Free PMC article. - Two-phase dynamics of p53 in the DNA damage response.
Zhang XP, Liu F, Wang W. Zhang XP, et al. Proc Natl Acad Sci U S A. 2011 May 31;108(22):8990-5. doi: 10.1073/pnas.1100600108. Epub 2011 May 16. Proc Natl Acad Sci U S A. 2011. PMID: 21576488 Free PMC article. - The pharmacodynamics of the p53-Mdm2 targeting drug Nutlin: the role of gene-switching noise.
Puszynski K, Gandolfi A, d'Onofrio A. Puszynski K, et al. PLoS Comput Biol. 2014 Dec 11;10(12):e1003991. doi: 10.1371/journal.pcbi.1003991. eCollection 2014 Dec. PLoS Comput Biol. 2014. PMID: 25504419 Free PMC article. - Changes in 5-Fluorouracil-induced external granular cell damage during the time-course of the developing cerebellum of infant rats.
Yamaguchi Y, Saito T, Takagi M, Nakazawa T, Tamura K. Yamaguchi Y, et al. J Toxicol Pathol. 2022 Oct;35(4):299-311. doi: 10.1293/tox.2022-0003. Epub 2022 May 30. J Toxicol Pathol. 2022. PMID: 36406170 Free PMC article.
References
- Meek D. W. (2009) Nat. Rev. Cancer 9, 714–723 - PubMed
- Murray-Zmijewski F., Slee E. A., Lu X. (2008) Nat. Rev. Mol. Cell Biol. 9, 702–712 - PubMed
- Vousden K. H., Lane D. P. (2007) Nat. Rev. Mol. Cell Biol. 8, 275–283 - PubMed
- Lahav G., Rosenfeld N., Sigal A., Geva-Zatorsky N., Levine A. J., Elowitz M. B., Alon U. (2004) Nat. Genet. 36, 147–150 - PubMed
Publication types
MeSH terms
Substances
LinkOut - more resources
Full Text Sources
Research Materials
Miscellaneous


