Dyrk1A phosphorylates p53 and inhibits proliferation of embryonic neuronal cells - PubMed (original) (raw)
Dyrk1A phosphorylates p53 and inhibits proliferation of embryonic neuronal cells
Joongkyu Park et al. J Biol Chem. 2010.
Abstract
Down syndrome (DS) is associated with many neural defects, including reduced brain size and impaired neuronal proliferation, highly contributing to the mental retardation. Those typical characteristics of DS are closely associated with a specific gene group "Down syndrome critical region" (DSCR) on human chromosome 21. Here we investigated the molecular mechanisms underlying impaired neuronal proliferation in DS and, more specifically, a regulatory role for dual-specificity tyrosine-(Y) phosphorylation-regulated kinase 1A (Dyrk1A), a DSCR gene product, in embryonic neuronal cell proliferation. We found that Dyrk1A phosphorylates p53 at Ser-15 in vitro and in immortalized rat embryonic hippocampal progenitor H19-7 cells. In addition, Dyrk1A-induced p53 phosphorylation at Ser-15 led to a robust induction of p53 target genes (e.g. p21(CIP1)) and impaired G(1)/G(0)-S phase transition, resulting in attenuated proliferation of H19-7 cells and human embryonic stem cell-derived neural precursor cells. Moreover, the point mutation of p53-Ser-15 to alanine rescued the inhibitory effect of Dyrk1A on neuronal proliferation. Accordingly, brains from embryonic DYRK1A transgenic mice exhibited elevated levels of Dyrk1A, Ser-15 (mouse Ser-18)-phosphorylated p53, and p21(CIP1) as well as impaired neuronal proliferation. These findings suggest that up-regulation of Dyrk1A contributes to altered neuronal proliferation in DS through specific phosphorylation of p53 at Ser-15 and subsequent p21(CIP1) induction.
Figures
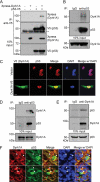
FIGURE 1.
Dyrk1A interacts and co-localizes with p53. A, co-immunoprecipitation/immunoblot analysis of interaction between Xpress-tagged Dyrk1A and V5-tagged p53 in HEK293 cells. Proper expression of the transiently expressed proteins was verified by immunoblot analysis with anti-Xpress or anti-V5 antibodies. The asterisk indicates immunoglobulin heavy chains. B, co-immunoprecipitation/immunoblot analysis of interaction between endogenous Dyrk1A and p53 in H19-7 cells. Immunoprecipitation was performed with rabbit polyclonal anti-p53 antibody or normal rabbit immunoglobulin G (as a negative control). C, representative confocal images of immunostaining for V5-tagged Dyrk1A (green) and p53 (red) in H19-7 cells. Nuclei were counterstained with DAPI (blue). Scale bar = 10 μm. D and E, reciprocal co-immunoprecipitation/immunoblot analyses of Dyrk1A-p53 interactions in E18.5 rat whole brain lysates. F, representative confocal images of immunohistochemistry for Dyrk1A (red) and p53 (green) in the hippocampus from E14.5 mice. Nuclei were counterstained with DAPI (blue). Scale bar = 10 μm. Arrowheads indicate the co-localization of Dyrk1A and p53 in the nuclear, perinuclear, and cytoplasmic regions.
FIGURE 2.
Dyrk1A directly phosphorylates human p53 at Ser-15. A, in vitro kinase assay of Dyrk1A-mediated phosphorylation of human p53. H1299 cells were transfected with plasmids encoding Xpress-tagged WT or kinase-inactive (K188R) Dyrk1A. Anti-Xpress immunoprecipitates were incubated with recombinant His6-tagged human p53 and [γ-32p]ATP. The reaction products were separated by SDS-PAGE, and autoradiograms were obtained. Asterisks indicate immunoglobulin heavy chains and nonspecific protein bands. B, Dyrk1A phosphorylates human p53 at serine residues. MCF-7 cells were transfected with plasmids encoding FLAG-tagged human p53 and Xpress-tagged WT or K188R Dyrk1A. Anti-FLAG immunoprecipitates were then probed with anti-phospho-serine, anti-phospho-threonine, anti-p53, and anti-FLAG antibodies. The asterisk indicates immunoglobulin heavy chains. C, immunoblot analysis of serine-phosphorylated p53 in U2OS cells transiently expressing Dyrk1A for varying times (0–72 h). Immunoblots were performed with six separate anti-phospho-p53 antibodies against serines 6, 9, 15, 20, 37, and 46. Levels of p53 and Dyrk1A protein were analyzed by re-probing membranes with anti-p53 and anti-Dyrk1A antibodies. D, immunoblot analysis of Ser-15-phosphorylated p53 in MCF-7 cells expressing Xpress-tagged WT or K188R Dyrk1A. E, in vitro kinase assays showing phosphorylation of human p53 at Ser-15 by Dyrk1A. Assays were performed with anti-Xpress immunoprecipitates (Xpress-tagged WT or K188R Dyrk1A) and recombinant His6-tagged WT or S15A mutant p53. Asterisks indicate immunoglobulin heavy chains and nonspecific protein bands. F, substitution of p53-S33A and p53-S90A does not affect Dyrk1A-mediated phosphorylation of p53. U2OS cells were transfected with V5-tagged human p53-WT alone or together with Xpress-tagged WT Dyrk1A. Where specified, Xpress-tagged WT Dyrk1A were co-transfected with p53-S33A or p53-S90A. Anti-V5 immunoprecipitates were then probed with anti-phospho-serine and anti-V5 antibodies. Proper expression of Dyrk1A was verified using immunoblot analysis with anti-Xpress antibody. The asterisk indicates immunoglobulin heavy chains. G, immunoblot analysis of Ser-15-phosphorylated p53 in primarily cultured rat cortical neurons expressing Xpress-tagged WT or K188R Dyrk1A.
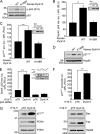
FIGURE 3.
Dyrk1A induces the expression of p53 target genes in H19-7 cells. A, immunoblot analysis of p53 and p53-phosphoSer-15 in H19-7 cells expressing Xpress-tagged WT or K188R Dyrk1A. B and C, luciferase activity of reporter plasmids containing a synthetic p53 responsive element (B) or the p21_CIP1_ promoter (C) in H19-7 cells expressing Xpress-tagged WT or K188R Dyrk1A (n = 3; **, p < 0.01 and ***, p < 0.001). Immunoblotting was used to verify proper expression of transiently expressed Dyrk1A proteins (anti-Xpress antibody). D, immunoblot analysis of p21CIP1 in H19-7 cells expressing Xpress-tagged WT or K188R Dyrk1A. Hsp90 served as a loading control. E and F, luciferase activity of reporter plasmids containing a synthetic p53 responsive element (E) or the p21_CIP1_ promoter (F) in H19-7/Dyrk1A cells (n = 3; ***, p < 0.001). Knockdown of endogenous p53 was verified with anti-p53 antibody. G, immunoblot analysis of p53 target gene products in H19-7/Dyrk1A cells. Hsp90 served as a loading control.
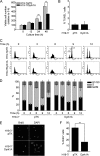
FIGURE 4.
Dyrk1A overexpression delays cell proliferation and induces G1/G0 phase accumulation in H19-7 cells. A, proliferation of H19-7/Dyrk1A cells and H19-7/pTK cells, as measured using a tetrazolium-based assay. Data are expressed in arbitrary units (n = 12; **, p < 0.001). _B_, cell death of H19-7/Dyrk1A and H19-7/pTK cells under the same condition, as measured using TUNEL assay. Data are expressed as the percentage of TUNEL-positive cells (846 cells were counted for H19-7/pTK, 1130 cells for H19-7/Dyrk1A) (_p_ > 0.9). C and D, cell cycle phase analysis of H19-7/Dyrk1A and H19-7/pTK cells after release from thymidine synchronization. Representative histogram images at each time point after release from thymidine synchronization (2 m
m
for 24 h) are shown (C). Data are expressed as the percentage of cell population in each phase (D) (n = 3; p < 0.001 for each comparison of G1/G0 phase population at 0–9 h). E and F, BrdU labeling in H19-7/Dyrk1A and H19-7/pTK cells. Cells were labeled with BrdU for 6 h. Scale bar = 50 μm. Data are expressed as the percentage of BrdU-positive cells (141 cells were counted for H19-7/pTK, 159 cells for H19-7/Dyrk1A) (**, p < 0.001).
FIGURE 5.
Overexpression of Dyrk1A attenuates proliferation of H19-7 cells through p53 phosphorylation at Ser-15. A, effect of p53-specific or scramble siRNAs (30 n
m
) on cell proliferation in H19-7/Dyrk1A cells and H19-7/pTK cells, as measured using a tetrazolium-based assay. Data are expressed in arbitrary units (n = 4; *, p < 0.05, **, p < 0.01, and ***, p < 0.001). Knockdown of endogenous p53 was verified using anti-p53 antibody. Hsp90 served as a loading control. B and C, effect of p53 siRNA (30 n
m
) or scramble siRNA (30 n
m
) on BrdU labeling in H19-7 cells expressing V5-tagged Dyrk1A. Immunostaining for V5 was performed to identify Dyrk1A-V5-positive cells. Scale bar = 50 μm. Data are expressed as the percentage of BrdU-positive cells. A total of 435 cells was counted for mock transfection and scrambled siRNA, 107 cells for Dyrk1A-V5 and scrambled siRNA, and 130 cells for Dyrk1A-V5 and p53 siRNA (*, p < 0.01 and ***, p < 0.0001). Knockdown of endogenous p53 was verified using anti-p53 antibody. Hsp90 served as a loading control. D and E, BrdU labeling in H19-7 cells expressing WT Dyrk1A and/or p53-S15A mutant. Scale bar = 50 μm. Data are expressed as the percentage of BrdU-positive cells and are reported as the mean ± S.E. A total of 593 cells was counted for mock transfection, 428 cells for p53-S15A, 625 cells for Dyrk1A WT, and 551 cells for Dyrk1A WT and p53-S15A (***, p < 0.0001).
FIGURE 6.
Overexpression of Dyrk1A attenuates proliferation of hES-NP cells through phosphorylation of p53 at Ser15. A–D, BrdU labeling in hES-NP cells overexpressing WT Dyrk1A and/or p53-S15A. Representative images of labeling in low density regions (A) and high density regions (B) are shown. Scale bar = 50 μm. In low density regions, a total of 656 cells was counted for mock transfection, 677 cells for p53-S15A, 906 cells for Dyrk1A WT, and 1,278 cells for Dyrk1A WT and p53-S15A (C). In high density regions, a total of 3,419 cells was counted for mock transfection, 1,657 cells for p53-S15A, 4,243 cells for Dyrk1A WT, and 2,743 cells for Dyrk1A WT and p53-S15A (D) (**, p < 0.001 and ***, p < 0.0001). E–G, immunoblot analysis of Ser-15-phosphorylated p53, p53, and p21CIP1 in hES-NP cells transiently expressing WT or K188R mutant Dyrk1A. Proper expression of Dyrk1A was verified with the anti-Dyrk1A antibody. Band intensity of p53-phosphoSer-15 and p21CIP1 from three independent immunoblots was quantified using Multi Gauge v3.1 software and normalized to that of p53 and HSP90, respectively. Data are expressed in arbitrary units (*, p < 0.05).
FIGURE 7.
Impaired neuronal proliferation, elevated p53 phosphorylation, and p21CIP1 levels in embryonic DYRK1A Tg mice. A and B, immunoblot analysis of Dyrk1A expression in whole brain lysates from E14.5 DYRK1A Tg mice and littermate controls. Band intensity of Dyrk1A was quantified and normalized to the intensity of Hsp90. Data are expressed in arbitrary units (n = 5 for Tg, n = 4 for C; ***, p < 0.001). C and D, BrdU labeling assay in the neocortex of E14.5 DYRK1A Tg mice (n = 4) and littermate controls (n = 2). E13.5-timed pregnant mice were intraperitoneally injected with BrdU for 24 h, and the embryos were surgically removed. Scale bar = 20 μm. Data are expressed as the percentage of BrdU-positive cells (green) against DAPI-stained total cells (blue) (*, p < 0.05). VZ/SVZ, ventricular/subventricular zone; IZ, intermediate zone. E and F, analysis of BrdU labeling in primarily cultured cortical neural stem cell precursors from E12.5 DYRK1A Tg embryos (n = 5) and in littermate controls (n = 4). Cells were labeled with BrdU for 12 h. Scale bar = 50 μm. Data are expressed as the percentage of BrdU-positive cells and are reported as the mean ± S.E. (**, p < 0.01). G and H, immunoblot analysis of Ser-18-phosphorylated p53 and p53 in whole brain lysates from E14.5 DYRK1A Tg mice and littermate controls. Band intensity of Ser-18-phosphorylated p53 was quantified and normalized to the intensity of p53 (n = 3 for each). Data are shown as the mean ± S.E. (*, p < 0.05). I and J, immunoblot analysis of p53 target gene products in whole brain lysates from E14.5 DYRK1A Tg mice and littermate controls. Band intensity of p21CIP1 was quantified and normalized to the intensity of Hsp90 (n = 3 for each). Data are shown as the mean ± S.E. (**, p < 0.01). K–M, immunoblot analysis of p53-phosphoSer-15 (L), and p21CIP1 (M) in the frontal cortices prepared from DS patient brains and age-matched controls. Band intensity was quantified and normalized to the intensity of p53 (L) or HSP90 (M) (*, p < 0.05 and **, p < 0.01).
Similar articles
- The Down syndrome-related protein kinase DYRK1A phosphorylates p27(Kip1) and Cyclin D1 and induces cell cycle exit and neuronal differentiation.
Soppa U, Schumacher J, Florencio Ortiz V, Pasqualon T, Tejedor FJ, Becker W. Soppa U, et al. Cell Cycle. 2014;13(13):2084-100. doi: 10.4161/cc.29104. Epub 2014 May 7. Cell Cycle. 2014. PMID: 24806449 Free PMC article. - Effect of DYRK1A activity inhibition on development of neuronal progenitors isolated from Ts65Dn mice.
Mazur-Kolecka B, Golabek A, Kida E, Rabe A, Hwang YW, Adayev T, Wegiel J, Flory M, Kaczmarski W, Marchi E, Frackowiak J. Mazur-Kolecka B, et al. J Neurosci Res. 2012 May;90(5):999-1010. doi: 10.1002/jnr.23007. Epub 2012 Jan 18. J Neurosci Res. 2012. PMID: 22252917 - Regulation of RCAN1 protein activity by Dyrk1A protein-mediated phosphorylation.
Jung MS, Park JH, Ryu YS, Choi SH, Yoon SH, Kwen MY, Oh JY, Song WJ, Chung SH. Jung MS, et al. J Biol Chem. 2011 Nov 18;286(46):40401-12. doi: 10.1074/jbc.M111.253971. Epub 2011 Sep 30. J Biol Chem. 2011. PMID: 21965663 Free PMC article. - [Molecular Mechanism Underlying Abnormal Differentiation of Neural Progenitor Cells in the Developing Down Syndrome Brain].
Kurabayashi N, Sanada K. Kurabayashi N, et al. Yakugaku Zasshi. 2017;137(7):795-800. doi: 10.1248/yakushi.16-00236-1. Yakugaku Zasshi. 2017. PMID: 28674289 Review. Japanese. - [Elucidating Pathogenic Mechanisms of Early-onset Alzheimer's Disease in Down Syndrome Patients].
Asai M, Kawakubo T, Mori R, Iwata N. Asai M, et al. Yakugaku Zasshi. 2017;137(7):801-805. doi: 10.1248/yakushi.16-00236-2. Yakugaku Zasshi. 2017. PMID: 28674290 Review. Japanese.
Cited by
- MicroRNA-298 determines the radio-resistance of colorectal cancer cells by directly targeting human dual-specificity tyrosine(Y)-regulated kinase 1A.
Shen MZ, Zhang Y, Wu F, Shen MZ, Liang JL, Zhang XL, Liu XJ, Li XS, Wang RS. Shen MZ, et al. World J Gastrointest Oncol. 2024 Apr 15;16(4):1453-1464. doi: 10.4251/wjgo.v16.i4.1453. World J Gastrointest Oncol. 2024. PMID: 38660649 Free PMC article. - From Churchill to Elephants: The Role of Protective Genes against Cancer.
Gazzellone A, Sangiorgi E. Gazzellone A, et al. Genes (Basel). 2024 Jan 18;15(1):118. doi: 10.3390/genes15010118. Genes (Basel). 2024. PMID: 38255007 Free PMC article. Review. - Effects of small molecules on neurogenesis: Neuronal proliferation and differentiation.
Jastrzębski MK, Wójcik P, Stępnicki P, Kaczor AA. Jastrzębski MK, et al. Acta Pharm Sin B. 2024 Jan;14(1):20-37. doi: 10.1016/j.apsb.2023.10.007. Epub 2023 Oct 20. Acta Pharm Sin B. 2024. PMID: 38239239 Free PMC article. Review. - Sex-specific developmental alterations in DYRK1A expression in the brain of a Down syndrome mouse model.
Hawley LE, Stringer M, Deal AJ, Folz A, Goodlett CR, Roper RJ. Hawley LE, et al. Neurobiol Dis. 2024 Jan;190:106359. doi: 10.1016/j.nbd.2023.106359. Epub 2023 Nov 20. Neurobiol Dis. 2024. PMID: 37992782 Free PMC article. - Regulation of CMGC kinases by hypoxia.
Kim K, Lee SB. Kim K, et al. BMB Rep. 2023 Nov;56(11):584-593. doi: 10.5483/BMBRep.2023-0165. BMB Rep. 2023. PMID: 37915135 Free PMC article. Review.
References
- Lejeune J., Gautier M., Turpin R. (1959) C. R. Hebd. Seances Acad. Sci. 248, 1721–1722 - PubMed
- Wisniewski K. E., Wisniewski H. M., Wen G. Y. (1985) Ann. Neurol. 17, 278–282 - PubMed
- Antonarakis S. E., Lyle R., Dermitzakis E. T., Reymond A., Deutsch S. (2004) Nat. Rev. Genet. 5, 725–738 - PubMed
- Wisniewski K. E., Laure-Kamionowska M., Wisniewski H. M. (1984) New Engl. J. Med. 311, 1187–1188 - PubMed
- Tanzi R. E. (1996) Nat. Med. 2, 31–32 - PubMed
Publication types
MeSH terms
Substances
LinkOut - more resources
Full Text Sources
Other Literature Sources
Medical
Molecular Biology Databases
Research Materials
Miscellaneous


