The PI3K isoforms p110alpha and p110delta are essential for pre-B cell receptor signaling and B cell development - PubMed (original) (raw)
The PI3K isoforms p110alpha and p110delta are essential for pre-B cell receptor signaling and B cell development
Faruk Ramadani et al. Sci Signal. 2010.
Abstract
B cell development is controlled by a series of checkpoints that ensure that the immunoglobulin (Ig)-encoding genes produce a functional B cell receptor (BCR) and antibodies. As part of this process, recombination-activating gene (Rag) proteins regulate the in-frame assembly of the Ig-encoding genes. The BCR consists of Ig proteins in complex with the immunoreceptor tyrosine-based activation motif (ITAM)-containing Igalpha and Igbeta chains. Whereas the activation of the tyrosine kinases Src and Syk is essential for BCR signaling, the pathways that act downstream of these kinases are incompletely defined. Previous work has revealed a key role for the p110delta isoform of phosphatidylinositol 3-kinase (PI3K) in agonist-induced BCR signaling; however, early B cell development and mature B cell survival, which depend on agonist-independent or "tonic" BCR signaling, are not substantially affected by a deficiency in p110delta. Here, we show that p110alpha, but not p110beta, compensated in the absence of p110delta to promote early B cell development in the bone marrow and B cell survival in the spleen. In the absence of both p110alpha and p110delta activities, pre-BCR signaling failed to suppress the production of Rag proteins and to promote developmental progression of B cell progenitors. Unlike p110delta, however, p110alpha did not contribute to agonist-induced BCR signaling. These studies indicate that either p110alpha or p110delta can mediate tonic signaling from the BCR, but only p110delta can contribute to antigen-dependent activation of B cells.
Figures
Fig. 1
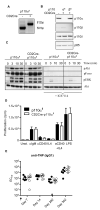
Intact PI3K signaling in B cells from CD2Cre-p110αfl mice. (A) PCR analysis of genomic DNA from purified B cells. The 812 kb band is from a recombined allele, whereas the 591 bp band is from an allele with both loxP sites intact. (B) Western blotting analysis of p110α, p110β, p110δ, and p85 from B cells purified from wild-type, CD2Cre-p110αfl, and CD2Cre-p110βfl mice. (C) Western blotting analysis of B cells stimulated with antibody against IgM F(ab’)2 for 3, 10, or 30 min. Blots were incubated with antibodies against pAkt (Ser407), pFoxo1 (Thr24)/Foxo3(Thr32), pERK (Ser202Tyr204), and total Akt. The cells in the panel on the right had been treated with IC87114 (5 μM). These data are representative of three experiments. (D) Proliferation of CD2Cre-p110αfl B cells in response to antibody against IgM F(ab’)2 (αIgM, 10 μg/ml), antibody against CD40 (αCD40,10 μg/ml), IL-4 (20 ng/ml), antibody against CD40 with IL-4, or LPS (10 μg/ml). The cpm represents the amount of 3H thymidine incorporated during the last 6 hours of the 48 hours of culture. The mean values represent averages from 6 mice analyzed in 3 independent experiments. The error bars represent the standard error of the mean (SEM). (E) Specific IgG1 titers after primary and secondary challenge. p110αfl (filled circles) and CD2Cre-p110αfl (open circles) mice were immunized with TNP-KLH on days 0 and day 292 and bled on days 7, 14, 292, and 302. EC50 values were calculated from serially diluted serum samples on TNP-BSA–coated plates. Each dot represents EC50 IgG1 values obtained from one of six mice per group.
Fig. 2
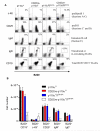
B cell development requires the activity of p110α or p110δ. (A) Flow cytometric analysis of lymphocytes from the bone marrow of the indicated mice. The percentages in each quadrant or gate are averages; p110αfl (n = 10 mice), CD2Cre-p110αfl (n = 6 mice), p110δD910A (n = 8 mice), CD2Cre-p110αflδD910A (n = 13 mice). (B) Total numbers (± SEM) of each B cell subset from two femurs of the indicated mice.
Fig. 3
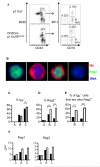
PI3K is required for pre-BCR-dependent inhibition of Rag expression. Immunofluorescent analysis of fraction A, B, or C cells purified from WT (p110αfl) or CD2Cre-p110αflδD910A mice. (A) Flow cytometric analysis showing the gating strategy used to sort B220+CD43+ bone marrow cells (depleted of Ter119+, Mac1+, and Gr1+ cells) into fractions A (CD19−BP1−), B (CD19+BP1−), and C (CD19+BP1+). (B) Representative images of cells incubated with antibodies against IgM (red) and Rag2 (green). The first cell imaged contained only Rag2, the second cell contained only Igμ, the third cell contained both proteins, whereas the fourth cell was negative for both proteins. (C to E) Percentages of p110αfl or CD2Cre-p110αflδD910A cells that stained positively for Igμ (C), Rag2 (D), or both Igμ and Rag2 (E); 200 to 500 cells from one experiment were scored per condition. (F) Gene-specific quantitative, real-time, reverse transcription PCR (QRT-PCR) analysis of cDNA prepared from fraction A, B, and C cells from p110αfl and CD2Cre-p110αflδD910A mice. ΔCt=Ct(Rag)-Ct(Hprt). Data is representative of two experiments.
Fig. 4
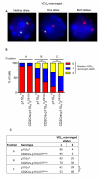
Enhanced VDJH recombination in the absence of PI3K signaling. FISH analysis of intergenic sequences in the Igμ locus. (A) Representative images of cells incubated with a probe that hybridizes between the VH and DH loci (green) or within the CH locus (red). The image on the left shows a cell with both loci intact. The image in the middle shows a cell that has lost the inter VH-JH segment (that is, it has undergone VH to DJH recombination) on one allele, whereas the image on the right shows a cell that has undergone VH to DJH recombination on both alleles. (B) Percentages of p110αfl or p110αflδD910A cells with zero (red), one (blue), or two (yellow) VDJH recombined alleles. More than 200 cells from two independent experiments were scored. (C) The ratio of cells that had undergone VH to DJH rearrangement on one versus two alleles is shown.
Fig. 5
Pre-BCR-dependent development and IL-7-dependent proliferation require PI3K activity. (A) _Rag2_−/− or CD2Cre-p110αflδD910A mice were injected with 1 mg of antibody against Igβ (HM-79) or with PBS as a negative control, and bone marrow cells were harvested 8 days later. The plots represent the number of B220+CD25+ cells in the lymphocyte gate. Three or four mice were analyzed per group in one experiment. (B) 5 × 10⁵ FACS-sorted B220+cKit+ B cells were incubated in duplicate on OP9 stromal cell layers in the presence of 10 or 20 ng of IL-7. After 5 days, the cell numbers in each well were determined. Data in B is representative of two experiments.
Fig. 6
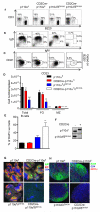
Defective development of mature B cells in CD2Cre-p110αflδD910A mice. Splenocytes from p110αfl (n = 11 mice), CD2Cre-p110αfl (n = 6 mice), p110αflδD910A (n = 11 mice), and CD2Cre-p110αflδD910A (n = 11 mice) mice were analyzed by flow cytometry for the indicated markers. (A) B220 (B cells) versus CD3 (T cells). (B) Splenocytes incubated with antibodies against IgM and IgD to detect immature transitional 1 (IgMhighIgDlow), transitional 2 (IgMhighIgDhigh), and mature (IgMlowIgDhigh) B cells. (C) B220+ cells were incubated with antibodies against CD21 and CD23 to distinguish FO cells (CD21lowCD23high) from marginal zone B cells (CD21highCD23low). (D) The mean total numbers of CD19+ B cells, FO B cells (CD21lowCD23high), and MZ B cells (CD21highCD23low) per spleen as calculated from the data in panels A to C (± SEM). (E) Percentages of viable B cells analyzed by DAPI staining. (F) PCR analysis of genomic DNA from purified B cells. The 812 kb band is from a recombined allele, whereas the 591 bp band is from an allele with both loxP sites intact. The lower band in each panel is from the floxed allele, whereas the upper band is from the recombined allele. (G) Detection of IgM+ (green) and IgD+ (red) B cells and CD4+ T cells (blue) in spleen slices from the indicated mice. (H) Detection of B cells (green), CD4+ T cells (blue), and dendritic cells (red) in slices of lymph nodes from the indicated mice. Data in G and H are representative images from two experiments with 2 mice per group.
Fig. 7
Reduced concentrations of serum Ig in CD2Cre-p110αflδD910A mice. Concentrations of IgM, IgG1, IgG2C and IgE in the sera from 3-4 mice per group was measured by ELISA and the concentration of each determined from a concentration curve using a know standard.
Fig. 8
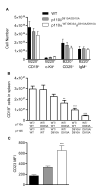
Intact B cell development in the bone marrow, but reduced spleen B cell numbers in p110αWT/D933AδD910A/D910A mice (A) Bone marrow cells from WT, p110δD910A/D910A and p110αWT/D933AδD910A/D910A mice were analyzed as in figure 2. (B) Total spleen cell numbers from each of the six possible genotypes resulting from p110αD933A and p110δD910A mouse crosses. (C) Mean fluorescent intensity of CD23 on WT, p110δD910A/D910A and p110αWT/D933AδD910A/D910A mice.
Comment in
- B cell receptor signaling: picky about PI3Ks.
Limon JJ, Fruman DA. Limon JJ, et al. Sci Signal. 2010 Aug 10;3(134):pe25. doi: 10.1126/scisignal.3134pe25. Sci Signal. 2010. PMID: 20699473 Review.
Similar articles
- B cell receptor signaling: picky about PI3Ks.
Limon JJ, Fruman DA. Limon JJ, et al. Sci Signal. 2010 Aug 10;3(134):pe25. doi: 10.1126/scisignal.3134pe25. Sci Signal. 2010. PMID: 20699473 Review. - Requirement for phosphoinositide 3-kinase p110delta signaling in B cell antigen receptor-mediated antigen presentation.
Al-Alwan MM, Okkenhaug K, Vanhaesebroeck B, Hayflick JS, Marshall AJ. Al-Alwan MM, et al. J Immunol. 2007 Feb 15;178(4):2328-35. doi: 10.4049/jimmunol.178.4.2328. J Immunol. 2007. PMID: 17277138 - Class IA Phosphatidylinositol 3-Kinase Isoform p110α Mediates Vascular Remodeling.
Vantler M, Jesus J, Leppänen O, Scherner M, Berghausen EM, Mustafov L, Chen X, Kramer T, Zierden M, Gerhardt M, Ten Freyhaus H, Blaschke F, Sterner-Kock A, Baldus S, Zhao JJ, Rosenkranz S. Vantler M, et al. Arterioscler Thromb Vasc Biol. 2015 Jun;35(6):1434-44. doi: 10.1161/ATVBAHA.114.304887. Epub 2015 Apr 23. Arterioscler Thromb Vasc Biol. 2015. PMID: 25908763 - The catalytic PI3K isoforms p110gamma and p110delta contribute to B cell development and maintenance, transformation, and proliferation.
Beer-Hammer S, Zebedin E, von Holleben M, Alferink J, Reis B, Dresing P, Degrandi D, Scheu S, Hirsch E, Sexl V, Pfeffer K, Nürnberg B, Piekorz RP. Beer-Hammer S, et al. J Leukoc Biol. 2010 Jun;87(6):1083-95. doi: 10.1189/jlb.0809585. Epub 2010 Mar 3. J Leukoc Biol. 2010. PMID: 20200404 - Role of PI3K in the generation and survival of B cells.
Werner M, Hobeika E, Jumaa H. Werner M, et al. Immunol Rev. 2010 Sep;237(1):55-71. doi: 10.1111/j.1600-065X.2010.00934.x. Immunol Rev. 2010. PMID: 20727029 Review.
Cited by
- Targeting MEF2D-fusion Oncogenic Transcriptional Circuitries in B-cell Precursor Acute Lymphoblastic Leukemia.
Tsuzuki S, Yasuda T, Kojima S, Kawazu M, Akahane K, Inukai T, Imaizumi M, Morishita T, Miyamura K, Ueno T, Karnan S, Ota A, Hyodo T, Konishi H, Sanada M, Nagai H, Horibe K, Tomita A, Suzuki K, Muramatsu H, Takahashi Y, Miyazaki Y, Matsumura I, Kiyoi H, Hosokawa Y, Mano H, Hayakawa F. Tsuzuki S, et al. Blood Cancer Discov. 2020 Jun 10;1(1):82-95. doi: 10.1158/2643-3230.BCD-19-0080. eCollection 2020 Jul. Blood Cancer Discov. 2020. PMID: 34661142 Free PMC article. - The PI-3-Kinase P110α Catalytic Subunit of T Lymphocytes Modulates Collagen-Induced Arthritis.
Montes-Casado M, Ojeda G, Criado G, Rojo JM, Portolés P. Montes-Casado M, et al. Int J Mol Sci. 2021 Jun 15;22(12):6405. doi: 10.3390/ijms22126405. Int J Mol Sci. 2021. PMID: 34203838 Free PMC article. - PI3Kδ-selective and PI3Kα/δ-combinatorial inhibitors in clinical development for B-cell non-Hodgkin lymphoma.
Lampson BL, Brown JR. Lampson BL, et al. Expert Opin Investig Drugs. 2017 Nov;26(11):1267-1279. doi: 10.1080/13543784.2017.1384815. Epub 2017 Oct 6. Expert Opin Investig Drugs. 2017. PMID: 28945111 Free PMC article. Review. - Subnuclear cyclin D3 compartments and the coordinated regulation of proliferation and immunoglobulin variable gene repression.
Powers SE, Mandal M, Matsuda S, Miletic AV, Cato MH, Tanaka A, Rickert RC, Koyasu S, Clark MR. Powers SE, et al. J Exp Med. 2012 Nov 19;209(12):2199-213. doi: 10.1084/jem.20120800. Epub 2012 Oct 29. J Exp Med. 2012. PMID: 23109711 Free PMC article. - Defective T-Cell Apoptosis and T-Regulatory Cell Dysfunction in Rheumatoid Arthritis.
Malemud CJ. Malemud CJ. Cells. 2018 Nov 22;7(12):223. doi: 10.3390/cells7120223. Cells. 2018. PMID: 30469466 Free PMC article. Review.
References
- Hardy RR, Hayakawa K. B cell development pathways. Annu Rev Immunol. 2001;19:595–621. - PubMed
- Corcoran AE, Riddell A, Krooshoop D, Venkitaraman AR. Impaired immunoglobulin gene rearrangement in mice lacking the IL-7 receptor. Nature. 1998;391:904–907. - PubMed
- Shinkai Y, Rathbun G, Lam KP, Oltz EM, Stewart V, Mendelsohn M, Charron J, Datta M, Young F, Stall AM, Alt FW. RAG-2-deficient mice lack mature lymphocytes owing to inability to initiate V(D)J rearrangement. Cell. 1992;68:855–867. - PubMed
- Kitamura D, Roes J, Kuhn R, Rajewsky K. A B cell-deficient mouse by targeted disruption of the membrane exon of the immunoglobulin mu chain gene. Nature. 1991;350:423–426. - PubMed
- Mombaerts P, Iacomini J, Johnson RS, Herrup K, Tonegawa S, Papaioannou VE. RAG-1-deficient mice have no mature B and T lymphocytes. Cell. 1992;68:869–877. - PubMed
Publication types
MeSH terms
Substances
Grants and funding
- BB/C505659/1/BB_/Biotechnology and Biological Sciences Research Council/United Kingdom
- BBS/E/B/0000L127/BB_/Biotechnology and Biological Sciences Research Council/United Kingdom
- BB/C505659/2/BB_/Biotechnology and Biological Sciences Research Council/United Kingdom
- BB/C509890/1/BB_/Biotechnology and Biological Sciences Research Council/United Kingdom
- BBS/E/B/0000M979/BB_/Biotechnology and Biological Sciences Research Council/United Kingdom
- BB/F015461/1/BB_/Biotechnology and Biological Sciences Research Council/United Kingdom
- JF19128/BB_/Biotechnology and Biological Sciences Research Council/United Kingdom
- MRC_/Medical Research Council/United Kingdom
- BBS/E/B/0000C236/BB_/Biotechnology and Biological Sciences Research Council/United Kingdom
LinkOut - more resources
Full Text Sources
Molecular Biology Databases
Research Materials
Miscellaneous
