An Atg9-containing compartment that functions in the early steps of autophagosome biogenesis - PubMed (original) (raw)
An Atg9-containing compartment that functions in the early steps of autophagosome biogenesis
Muriel Mari et al. J Cell Biol. 2010.
Abstract
Eukaryotes use the process of autophagy, in which structures targeted for lysosomal/vacuolar degradation are sequestered into double-membrane autophagosomes, in numerous physiological and pathological situations. The key questions in the field relate to the origin of the membranes as well as the precise nature of the rearrangements that lead to the formation of autophagosomes. We found that yeast Atg9 concentrates in a novel compartment comprising clusters of vesicles and tubules, which are derived from the secretory pathway and are often adjacent to mitochondria. We show that these clusters translocate en bloc next to the vacuole to form the phagophore assembly site (PAS), where they become the autophagosome precursor, the phagophore. In addition, genetic analyses indicate that Atg1, Atg13, and phosphatidylinositol-3-phosphate are involved in the further rearrangement of these initial membranes. Thus, our data reveal that the Atg9-positive compartments are important for the de novo formation of the PAS and the sequestering vesicle that are the hallmarks of autophagy.
Figures
Figure 1.
The Atg9-GFP construct for IEM analyses. (A) The prApe1 processing is normal in Atg9-GFP–expressing cells. The atg9Δ (JCK007) mutant transformed with either an empty vector (pRS416), a plasmid carrying the ATG9 gene (pJK1-2416), or the ATG9-GFP fusion (pATG9GFP416) was grown in YPD medium to log phase before analyzing prApe1 maturation by immunoblotting. The cytosolic protein Pgk1 was used as a loading control. Mr is indicated in kilodaltons. The black line indicates that intervening lanes have been spliced out. (B) Autophagy is normal in the presence of Atg9-GFP. The atg9Δ (FRY300) cells expressing Pho8Δ60 and transformed with the same plasmids described in A were shifted from YPD medium (dark gray bars) to SD-N medium (light gray bars) for 4 h. Autophagy induction was determined by a Pho8 activity assay. (C and D) Atg9-GFP has a normal distribution, and one of the Atg9-GFP-containing puncta is the PAS. Strains expressing Atg9-GFP under the control of the ATG9 promoter (FRY162) or the TPI1 promoter (MMY067) were transformed with a plasmid (promRFPATG8415) carrying the PAS protein marker RFP-Atg8. (C) Transformants were cultured to log phase and imaged. The number of Atg9-GFP puncta per cell was counted (D) and error bars represent the standard deviation of the mean. Arrowheads highlight colocalizations. (E and F) Part of Atg9-GFP distributes to mitochondria. The strains analyzed in C were transformed with the pmitoDsRed415 plasmid expressing mitochondria-targeted RFP and imaged (E). Arrowheads highlight Atg9 puncta adjacent to mitochondria. Determination of Atg9-GFP puncta distribution on mitochondria (F) was determined as described in Materials and methods, and error bars represent the standard deviation of the mean. DIC, differential interference contrast. Bar, 2 µm.
Figure 2.
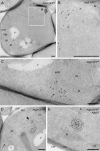
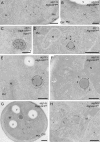
IEM analysis of wild-type cells expressing Atg9-GFP. Atg9-GFP (MMY067) cells were grown to log phase and processed for IEM as described in Materials and methods. Preparations shown in A–D were immunogold labeled only for GFP, whereas those presented in E were double immunogold labeled for GFP and Ape1. (A) Overview of a labeled cell section. (B) Insets of A illustrating an Atg9-positive cluster of vesicles and tubules. (C) Atg9-containing membranous arrangements (arrow) adjacent to mitochondria (≤ 50 nm distance). (D) Micrograph showing a GFP-labeled cell with two Atg9 clusters (marked by an arrow and an arrowhead), one of which (arrowhead) associated with an electron-dense structure with a 100–150 nm diameter (broken lines). (E) The circular electron-dense structures found in close proximity to the Atg9 clusters and labeled for Ape1 are Cvt complexes (broken lines). The dashed cisterna emphasizes the Cvt complex surface not associated with Atg9-containing membranes. D and E are also shown in
Fig. S1 (A and B)
without broken lines for clarity, while additional examples of Atg9 clusters are presented in Fig. S1, C–H. The size of the gold particles is indicated on the top of each picture. CW, cell wall; M, mitochondria; MVB, multivesicular body; N, nucleus; PM, plasma membrane; V, vacuole. Bars, 200 nm.
Figure 3.
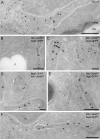
Mitochondrial protein markers do not localize to the Atg9 clusters. (A) Ultrathin cryosections obtained from a wild-type (MMY067) strain were immunogold labeled only for Por1 because the anti-Por1 antibody does not work in double labeling. The broken line highlights an Atg9 cluster. (B–F) Cells expressing both Atg9-GFP and the mitochondrial marker Idh1-3xHA (MOY003) were processed for IEM, and cryo-sections were double immunogold labeled for GFP and HA. CW, cell wall; M, mitochondria; N, nucleus; PM, plasma membrane; V, vacuole. Bars, 200 nm.
Figure 4.
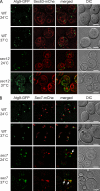
Atg9 is transported through part of the secretory pathway. (A) Atg9 is translocated into the ER. The wild-type (MMY126) and sec12 (MMY129) cells expressing Sec63-mChe-V5 and carrying the pGalATG9GFP416 plasmid were grown in SMD at 24°C before being transferred into a galactose-containing medium. Cultures were subsequently split and separately incubated at either 24°C or 37°C for 2 h before imaging. No fluorescence signal was detected when cells were grown in the presence of glucose (not depicted). (B) Atg9 passes through the Golgi before reaching its final destination. Wild-type (MMY125) and sec7 (MMY127) cells expressing genomically mChe-V5–tagged Sec7 and Sec7ts, respectively, and transformed with the pGalATG9GFP416 plasmid were analyzed as in A. Arrows highlight the colocalization between Atg9-GFP and Sec7ts-mChe in sec7ts cells at 37°C. DIC, differential interference contrast. Bars, 2 µm.
Figure 5.
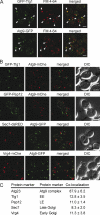
Atg9 concentrates into a novel organelle. (A) Atg9-GFP colocalizes with some FM 4-64-positive puncta shortly after endocytosis. The strains expressing genomically GFP-tagged Tlg1 (FRY360) or Atg9 (FRY162) were grown to log phase and then exposed to FM 4-64 as described in Materials and methods. Arrowheads highlight the colocalization between FM 4-64 and GFP-Tlg1 or Atg9-GFP. (B) Atg9 does not colocalize with endosomal and Golgi protein markers. The Atg9-GFP Vrg4-mChe-V5 (FRY340), Atg9-GFP Sec7-dsRED (FRY341), GFP-Tlg1 Atg9-mChe-V5 (FRY342), and GFP-Pep12 Atg9-mChe-V5 (FRY344) strains were grown to log phase before being fixed and imaged. Bars, 2 µm. (C) The colocalization experiments shown in B were statistically evaluated as described in Materials and methods. Atg23 was used as a positive control for colocalization because forming a complex with Atg9 (Reggiori et al., 2004a). DIC, differential interference contrast.
Figure 6.
Atg9-GFP distribution in various atg mutants. The atg11Δ (MMY069; A and B), atg1Δ (MMY068; C and D), atg13Δ (MMY070; E and F), and atg14Δ (MMY071; G and H) strains were grown and processed as described in Fig. 2. Cryosections were immunolabeled for GFP alone (A, B, and D–J) or in combination with Ape1 (C). (A and B) The Atg9 reservoirs observed in atg11Δ cells. (C and D) The PAS accumulated in the atg1Δ knockout. (E and F) The PAS present in the atg13Δ strain displays a Cvt complex surrounded by numerous small vesicles. (G and H) Enrichment of tubular membranes at the PAS of the atg14Δ mutant. Cvt complexes are highlighted with broken lines. D–F are also shown in
Fig. S4 (E, F, I, and J)
without dashed lines for clarity, while additional examples are presented in Fig. S4 (A–D, G, H, and K–Q). CW, cell wall; M, mitochondria; N, nucleus; PM, plasma membrane; V, vacuole. Bars, 200 nm.
Figure 7.
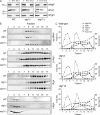
Subcellular fractionation of Atg9 clusters in wild-type, atg11Δ, and atg1Δ backgrounds. (A) The Atg9-PA (FRY172), Atg9-PA atg11Δ pep4Δ (FRY250), and Atg9-PA atg1Δ pep4Δ (FRY196) strains were grown to log phase, converted to spheroplasts, and lysed, then cell extracts were centrifuged at 13,000 g for 15 min. The cell extract (T), the supernatant (S13), and the pellet (P13) fractions were then separated by SDS-PAGE, and Atg9 distribution was analyzed by Western blotting using anti-PA antibodies. Efficient lysis and correct fractionation were assessed by verifying the partitioning of cytosolic Pgk1 and mitochondrial Por1. Mr is indicated in kilodaltons. (B) The S13 supernatants were fractionated on sucrose step-density gradients, and the fractions were analyzed by Western blotting using antisera against PA (for Atg9-PA), Pep12, Tlg1, and Pgk1. (C) Quantification of the immunoblots.
Figure 8.
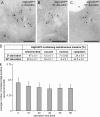
The Atg9 reservoirs move en bloc to become the PAS. The ape1Δ atg1Δ (MMY078) double mutant was grown to log phase before being nitrogen starved to induce autophagy. Cell aliquots were collected after 0, 10, 20, 30, 45, and 60 min. They were then processed for IEM, and cryosections were immunogold labeled for GFP (A–C). (A) An Atg9 reservoir adjacent to a mitochondrion observed at the 0 min time point. (B and C) Atg9 clusters close to the vacuole limiting membrane detected after 60 min of starvation. The gold particles size is indicated on the top of each picture. M, mitochondria; V, vacuole. Bars, 200 nm. (D) Relative subcellular distribution of the Atg9-GFP clusters in the ape1Δ atg1Δ cells before and after induction of autophagy for 60 min. Statistical analyses were performed as described in Materials and methods. (E) The number of isolated Atg9-positive vesicles in the cytoplasm does not increase after triggering Atg9 relocalization in the ape1Δ atg1Δ mutant by autophagy induction. 100 cell profiles were randomly selected and the number of isolated Atg9-positive vesicles per cell profile was established. Results in D and E are expressed in percentages ± the standard error of the mean (error bars).
Figure 9.
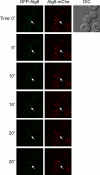
Live cell imaging of an Atg9 reservoir becoming the PAS. Atg9-mChe GFP-Atg8 (MMY120) cells were grown to log phase and transferred to SD-N medium for 20 min before being imaged as described in Materials and methods. Sequential images acquired with a time lapse of 5 s are shown. The arrow highlights the Atg9 reservoirs that ultimately colocalize with Atg8 in the process of becoming the PAS. The complete movie reconstruction is presented in
Video 1
. An identical result was obtained with cells expressing endogenous Atg9-GFP (FRY172) and carrying the pCumCheV5ATG8415 plasmid, which expresses mChe-Atg8 (
Video 2
). DIC, differential interference contrast. Bar, 2 µm.
Figure 10.
Model for the role of the Atg9 reservoirs in double-membrane vesicle formation. The Atg9 reservoirs, which often are adjacent to mitochondria, act as a pre-PAS. Association with the prApe1 oligomer in nutrient-rich conditions (Cvt pathway) and probably cellular signals during starvation (autophagy) induces the translocation of one or more Atg9 reservoirs into close proximity with the vacuole. This relocalization event triggers the recruitment of the rest of the Atg proteins to a reservoir, leading to the formation of the PAS. Successive fusion of the tubulovesicular membranes composing the PAS and possibly acquisition of additional membrane from other Atg9 reservoirs and/or other sources creates a double-membrane vesicle.
Similar articles
- A role for Atg8-PE deconjugation in autophagosome biogenesis.
Nair U, Yen WL, Mari M, Cao Y, Xie Z, Baba M, Reggiori F, Klionsky DJ. Nair U, et al. Autophagy. 2012 May 1;8(5):780-93. doi: 10.4161/auto.19385. Epub 2012 May 1. Autophagy. 2012. PMID: 22622160 Free PMC article. - Self-interaction is critical for Atg9 transport and function at the phagophore assembly site during autophagy.
He C, Baba M, Cao Y, Klionsky DJ. He C, et al. Mol Biol Cell. 2008 Dec;19(12):5506-16. doi: 10.1091/mbc.e08-05-0544. Epub 2008 Oct 1. Mol Biol Cell. 2008. PMID: 18829864 Free PMC article. - Atg13 HORMA domain recruits Atg9 vesicles during autophagosome formation.
Suzuki SW, Yamamoto H, Oikawa Y, Kondo-Kakuta C, Kimura Y, Hirano H, Ohsumi Y. Suzuki SW, et al. Proc Natl Acad Sci U S A. 2015 Mar 17;112(11):3350-5. doi: 10.1073/pnas.1421092112. Epub 2015 Mar 3. Proc Natl Acad Sci U S A. 2015. PMID: 25737544 Free PMC article. - Atg9 trafficking in the yeast Saccharomyces cerevisiae.
Mari M, Reggiori F. Mari M, et al. Autophagy. 2007 Mar-Apr;3(2):145-8. doi: 10.4161/auto.3608. Epub 2007 Mar 21. Autophagy. 2007. PMID: 17204846 Review. - Transcriptional regulation of ATG9 by the Pho23-Rpd3 complex modulates the frequency of autophagosome formation.
Jin M, Klionsky DJ. Jin M, et al. Autophagy. 2014 Sep;10(9):1681-2. doi: 10.4161/auto.29641. Epub 2014 Jul 7. Autophagy. 2014. PMID: 25046109 Free PMC article. Review.
Cited by
- Autophagic processes in yeast: mechanism, machinery and regulation.
Reggiori F, Klionsky DJ. Reggiori F, et al. Genetics. 2013 Jun;194(2):341-61. doi: 10.1534/genetics.112.149013. Genetics. 2013. PMID: 23733851 Free PMC article. Review. - PI3P binding by Atg21 organises Atg8 lipidation.
Juris L, Montino M, Rube P, Schlotterhose P, Thumm M, Krick R. Juris L, et al. EMBO J. 2015 Apr 1;34(7):955-73. doi: 10.15252/embj.201488957. Epub 2015 Feb 17. EMBO J. 2015. PMID: 25691244 Free PMC article. - Tales of the autophagy crusaders.
Kalie E, Tooze SA. Kalie E, et al. EMBO Rep. 2012 Mar 1;13(3):175-7. doi: 10.1038/embor.2012.7. EMBO Rep. 2012. PMID: 22310299 Free PMC article. - RAB2 regulates the formation of autophagosome and autolysosome in mammalian cells.
Ding X, Jiang X, Tian R, Zhao P, Li L, Wang X, Chen S, Zhu Y, Mei M, Bao S, Liu W, Tang Z, Sun Q. Ding X, et al. Autophagy. 2019 Oct;15(10):1774-1786. doi: 10.1080/15548627.2019.1596478. Epub 2019 Apr 6. Autophagy. 2019. PMID: 30957628 Free PMC article. - Atg9 establishes Atg2-dependent contact sites between the endoplasmic reticulum and phagophores.
Gómez-Sánchez R, Rose J, Guimarães R, Mari M, Papinski D, Rieter E, Geerts WJ, Hardenberg R, Kraft C, Ungermann C, Reggiori F. Gómez-Sánchez R, et al. J Cell Biol. 2018 Aug 6;217(8):2743-2763. doi: 10.1083/jcb.201710116. Epub 2018 May 30. J Cell Biol. 2018. PMID: 29848619 Free PMC article.
References
Publication types
MeSH terms
Substances
LinkOut - more resources
Full Text Sources
Other Literature Sources
Molecular Biology Databases
Research Materials

