The dynamic interaction of AMBRA1 with the dynein motor complex regulates mammalian autophagy - PubMed (original) (raw)
. 2010 Oct 4;191(1):155-68.
doi: 10.1083/jcb.201002100.
Marco Corazzari, Francesca Nazio, Serafina Oliverio, Gaia Lisi, Manuela Antonioli, Vittoria Pagliarini, Silvia Matteoni, Claudia Fuoco, Luigi Giunta, Marcello D'Amelio, Roberta Nardacci, Alessandra Romagnoli, Mauro Piacentini, Francesco Cecconi, Gian Maria Fimia
Affiliations
- PMID: 20921139
- PMCID: PMC2953445
- DOI: 10.1083/jcb.201002100
The dynamic interaction of AMBRA1 with the dynein motor complex regulates mammalian autophagy
Sabrina Di Bartolomeo et al. J Cell Biol. 2010.
Abstract
Autophagy is an evolutionary conserved catabolic process involved in several physiological and pathological processes such as cancer and neurodegeneration. Autophagy initiation signaling requires both the ULK1 kinase and the BECLIN 1-VPS34 core complex to generate autophagosomes, double-membraned vesicles that transfer cellular contents to lysosomes. In this study, we show that the BECLIN 1-VPS34 complex is tethered to the cytoskeleton through an interaction between the BECLIN 1-interacting protein AMBRA1 and dynein light chains 1/2. When autophagy is induced, ULK1 phosphorylates AMBRA1, releasing the autophagy core complex from dynein. Its subsequent relocalization to the endoplasmic reticulum enables autophagosome nucleation. Therefore, AMBRA1 constitutes a direct regulatory link between ULK1 and BECLIN 1-VPS34, which is required for core complex positioning and activity within the cell. Moreover, our results demonstrate that in addition to a function for microtubules in mediating autophagosome transport, there is a strict and regulatory relationship between cytoskeleton dynamics and autophagosome formation.
Figures
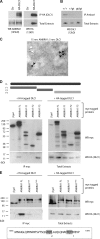
Figure 1.
AMBRA1 interacts with DLC1. (A) AMBRA1–DLC1 interaction in mammalian cells. 2F cells were infected with a retroviral vector encoding HA-DLC1 or an empty vector (control [Ctr]). Protein extracts were subjected to IP using an anti-HA antibody (IP HA; DLC1). Purified complexes and corresponding total extracts were analyzed by WB using anti-AMBRA1 (WB AMBRA1; left) or anti-HA antibodies (WB HA; right). (B) AMBRA1–Dlc1 interaction in mouse embryos. Protein extracts from embryos at developmental day 14.5 wild-type (+/+), heterozygous (+/gt), and homozygous (gt/gt) for the Ambra1 gene trap mutation were subjected to IP using an anti-AMBRA1 antibody (IP AMBRA1). Purified complexes and corresponding total extracts were analyzed by WB using an anti-DLC1 antibody (WB Dlc1). (C) AMBRA1–DLC1 colocalization in mammalian cells. Immunogold analysis of 2F cells coexpressing HA-DLC1 and AMBRA1. 15-nm and 5-nm gold particles label the AMBRA1 and DLC1 proteins, respectively. Black arrows point to AMBRA1–DLC1-colocalizing proteins, whereas white arrows indicate a single DLC1 molecule. A larger, low-magnification area of the same section is shown in
Fig. S1 A
. Bar, 45 nm. (D and E) Characterization of the DLC1-interacting domain of AMBRA1. (D) 2F cells were coinfected with retroviral vectors encoding HA-tagged DLC1 and the indicated Myc-tagged AMBRA1 proteins or Myc-tagged βgal as a negative control. FL, full length; F1–3, fragments 1–3 (a scheme of the AMBRA1 mutants with the corresponding amino acid sequence boundary is reported; the light gray bar indicates the DLC1-interacting fragment). Protein extracts were subjected to IP using an anti-Myc antibody (IP Myc). Purified complexes and corresponding total extracts were analyzed by WB using anti-Myc (WB Myc; top) and anti-HA antibody (WB HA [DLC1]; bottom). (E) 2F cells were coinfected with retroviral vectors encoding HA-tagged DLC1 and the Myc-tagged AMBRA1 FL or AMBRA1 mutants TAT1 and TAT2. The positions within the AMBRA1 sequence of the two TQT domains (1 and 2), which were mutated in the TAT mutants, are shown (gray boxes). Protein extracts were subjected to IP using an anti-Myc antibody (IP Myc). Purified complexes and corresponding total extracts were analyzed by WB using an anti-Myc (WB Myc; top) and anti-HA antibody (WB HA [DLC1]; bottom).
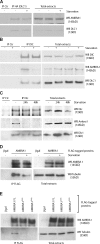
Figure 2.
Modulation of AMBRA1–dynein interaction during autophagy. (A) AMBRA1–DLC1 interaction upon autophagy induction. 2F cells coinfected with retroviral vectors encoding HA-tagged DLC1 and AMBRA1 proteins were nutrient starved for 4 h (+) or left untreated (−). Protein extracts were subjected to IP with an anti-HA–tagged antibody (IP HA; DLC1) or, as a negative control, with an unrelated antibody (IP control [Ctr]). Purified complexes were analyzed together with the corresponding total extracts by WB using anti-AMBRA1 (WB AMBRA1; top) and anti-DLC1 antibodies (WB DLC1; bottom). (B) AMBRA1 dissociates from the dynein motor complex during autophagy. 2F cells were nutrient starved for 4 h or left untreated. Protein extracts were subjected to IP using an anti-DIC (IP DIC) or an unrelated antibody (IP Ctr) as a negative control. The purified complexes were analyzed by WB together with the corresponding total extracts by using anti-DIC (WB DIC; top), anti-AMBRA1 (WB AMBRA1; middle), and anti-DLC1 antibodies (WB DLC1; bottom). (C) AMBRA1 dissociates from the dynein motor complex in mouse tissues after autophagy induction. Mice from the same litter were kept without food for 24 and 48 h or fed ad libitum (−) before sacrifice and necropsy. Kidneys from these mice were homogenized and subjected to IP analysis by using an anti-DIC antibody (IP DIC) or with an unrelated antibody (IP Ctr). Protein immunocomplexes were probed together with the corresponding total extracts using anti-DIC (WB DIC, top), anti-AMBRA1 (WB AMBRA1; middle), and anti-DLC1 (WB DLC1; bottom) antibodies. (D) AMBRA1 dissociates from tubulin upon autophagy induction. 2F cells infected with retroviral vectors encoding Flag-tagged βgal or AMBRA1 proteins were nutrient starved for 4 h or left untreated. Protein extracts were subjected to IP with an anti-Flag antibody (IP Flag). Purified proteins were eluted using the Flag peptide and analyzed by WB together with the corresponding total extracts using anti-AMBRA1 (WB AMBRA1; top) and anti–α-tubulin antibodies (WB tubulin; bottom). (E) AMBRA1 interacts with tubulin via DLC1. 2F cells were coinfected with retroviral vectors encoding Flag-tagged AMBRA1 FL, AMBRA1TAT1, or AMBRA1TAT2. Protein extracts were subjected to IP using an anti-Flag antibody (IP Flag). Purified complexes and corresponding total extracts were analyzed by WB using an anti-AMBRA1 (WB AMBRA1; Top) or anti–α-tubulin antibody (WB tubulin; bottom).
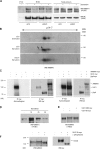
Figure 3.
AMBRA1 is phosphorylated during autophagy in an ULK1-dependent manner. (A) Down-regulation of ULK1 expression prevents AMBRA1 dissociation from the dynein motor complex during autophagy. ULK1 was down-regulated in 2F cells using specific siRNA oligonucleotides (siULK1). ULK1 expression level was analyzed by quantitative PCR and WB analyses (
Fig. S2 A
). siCtr, unrelated oligonucleotides. 48 h after transfection, 2F cells were starved for 4 h or left untreated. Protein extracts were prepared and subjected to IP using an anti-DIC (IP DIC) or an unrelated antibody (IP control [Ctr]) as a negative control. The purified complexes were analyzed by WB together with the corresponding total extracts using anti-DIC (WB DIC; bottom) and anti-AMBRA1 antibodies (WB AMBRA1; top). (B) Analysis of AMBRA1 modification after autophagy induction in control and ULK1 down-regulated cells. Protein extracts from samples as described in A were resolved by bidimensional gel electrophoresis (2DE) and analyzed by WB using an anti-AMBRA1 antibody. pI 4–7, isoelectric pH gradient 4–7; MW, molecular weight. AMBRA1 protein spots induced by starvation are indicated (arrows). Broken line highlights the isoelectric shift of the AMBRA1 isoforms produced by ULK1 activity. (C) Immunopurified ULK1 phosphorylates AMBRA1 in vitro. HEK293 cells were transfected with expression vectors encoding either AMBRA1 or ULK1 Myc-tagged proteins. 24 h after transfection, ULK1-expressing cells were nutrient starved for 2 h to stimulate ULK1 activity. Protein extracts were prepared from transfected cells and subject to IP using an anti-Myc antibody (IP Myc). An aliquot of the immunoprecipitated proteins was analyzed by WB using an anti-Myc antibody (WB Myc) to check for protein purification (right). Immunopurified ULK1 proteins were subjected to an in vitro kinase assay in the presence (+) or absence (−) of immunopurified AMBRA1 as described in Materials and methods. As negative control for kinase activity (−), the in vitro kinase assay was performed using anti-Myc–immunopurified complexes from βgal-transfected cells (βgal Myc). The reactions were resolved on SDS-PAGE and 32P-labeled proteins revealed by autoradiography (left). (D) Electrophoretic mobility hypershift of AMBRA1 upon autophagy induction. HEK293 cells were nutrient-starved for 1, 2, and 3 h. Protein extracts were prepared, loaded on a polyacrylamide gel (see Materials and methods) and analyzed by WB using an anti-AMBRA1 antibody (WB AMBRA1). (E) ULK1 phosphorylates AMBRA1. HEK293 cells were transfected with expression vectors encoding AMBRA1–Flag together with wild-type (Wt) ULK1 or K46I ULK1 Myc-tagged proteins. 48 h after transfection, protein extracts were prepared and subjected to WB using an anti-AMBRA1 antibody (WB AMBRA1). (F) HEK293 cells were transfected with an expression vector encoding Myc-tagged wild-type ULK1. 48 h after transfection, cells were lysed with HEMG and subjected to an in vitro λ-phosphatase assay as described in Materials and methods. After denaturation, protein extracts were subjected to WB using anti-AMBRA1 (WB AMBRA1; left) and anti-Myc (WB Myc; right) antibodies.
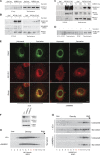
Figure 4.
AMBRA1 translocates to the ER after autophagy induction. (A) AMBRA1 relocalizes to the ER upon autophagy induction. 2F cells expressing mCherryAMBRA1 (red) and ER-GFP (a GFP protein with an ER localization signal peptide; green) proteins were starved for 4 h or left untreated, fixed with 4% PFA followed by permeabilization with ice-cold methanol, stained with an anti-AMBRA1 antibody, and analyzed by confocal microscopy. (bottom) The images showing the merge of the two fluorescence signals are shown. Colocalization was assessed by calculating the Pearson’s correlation coefficient r of at least 10 cells analyzed in two independent experiments. (mean r: untreated, 0.42 ± 0.06; starvation, 0.62 ± 0.07) Bar, 12 µm. (B) AMBRA1 translocates to ER-enriched fractions upon autophagy induction. Postmitochondrial protein extracts from 2F cells nutrient starved for 4 h or left untreated were fractionated by discontinuous sucrose gradient sedimentation (see Materials and methods). Gradient fractions (1–13) were analyzed by WB using the indicated antibodies. The calnexin-positive fractions enriched in AMBRA1–BECLIN 1 upon starvation are indicated in red.
Figure 5.
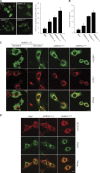
AMBRA1 is required for BECLIN 1 translocation to the ER after autophagy induction. (A) VPS34–AMBRA1 interaction upon autophagy induction. 2F cells infected with retroviral vectors encoding βgal Myc or AMBRA1 Myc proteins were nutrient starved for 4 h (+) or left untreated (−). Protein extracts were subjected to IP with an anti-Myc antibody (IP Myc). Purified complexes were analyzed together with the corresponding total extracts by WB using an anti-VPS34 antibody (WB VPS34). (B) BECLIN 1 interacts with DLC1. 2F cells were transiently transfected with expression plasmids encoding βgal or Flag-tagged BECLIN 1 and nutrient starved for 4 h (+) or left untreated (−). Protein extracts were subjected to IP using an anti-Flag antibody. Purified complexes were analyzed together with the corresponding total extracts by WB using anti–BECLIN 1 (WB BECLIN 1; top), anti-AMBRA1 (WB AMBRA1; middle), and anti-DLC1 antibodies (WB DLC1; bottom). (C) BECLIN 1 binding to DLC1 is mediated by AMBRA1. 2F cells were transiently transfected with expression plasmids encoding βgal or Flag-tagged BECLIN 1 together with Myc-tagged AMBRA1 full length (FL) or TAT2. Protein extracts were subjected to IP using an anti-Flag antibody. Purified complexes were analyzed together with the corresponding total extracts by WB using anti-BECLIN 1 (WB BECLIN 1; top), anti-Myc (WB AMBRA1; middle), and anti-DLC1 antibodies (WB DLC1; bottom). (D) Dynamic interaction of BECLIN 1 with the dynein motor complex during autophagy. Protein extracts from AMBRA1 expressing 2F cells were subjected to IP using an anti-DIC antibody (IP DIC) or an unrelated antibody (IP control [Ctr]). The purified complexes were analyzed together with the corresponding total extracts by WB using an anti–BECLIN 1 antibody (WB BECLIN 1). (right) The BECLIN 1–DIC interaction was also analyzed in untreated (−) or starved (+) cells. (E) 2F cells were transfected with AMBRA1 siRNA (siAMBRA1) or unrelated oligonucleotides (siCtr). 24 h after transfection, cells were starved for 4 h or left untreated, fixed, and stained with the anti–BECLIN 1 (red) and anti-ERp57 (green) antibodies. (right) The images showing the merge of the two fluorescence signals are shown. Colocalization was assessed by calculating the Pearson’s correlation coefficient r of at least 10 cells analyzed in two independent experiments (mean r: siCtr, 0.35 ± 0.17; starvation, 0.58 ± 0.19; siAMBRA1 untreated, 0.28 ± 0.06; starvation, 0.39 ± 0.03). Similar results were obtained in cells transfected with AMBRA1 siRNA1 (not depicted). Bar, 8 µm. (F) Analysis of BECLIN 1 protein levels after AMBRA1 down-regulation. AMBRA1 and BECLIN 1 expression levels in cells described in E were analyzed by WB analysis using specific antibodies. Tubulin, protein loading control. (G and H) AMBRA1 down-regulation impairs BECLIN 1 translocation to ER. 2F cells were transfected with AMBRA1 RNAi oligonucleotides (siAMBRA1) or unrelated oligonucleotides as a control (siCtr). Postmitochondrial protein extracts from 2F cells nutrient starved for 4 h or left untreated were fractionated by discontinuous sucrose gradient sedimentation (see Materials and methods). (G) Gradient fractions (1–13) were analyzed by WB using an anti–BECLIN 1 antibody. (H) Gradient fractions were also analyzed for calnexin distribution to verify similar fractionation efficiency between siCtr and siAMBRA1 cells. The calnexin-positive fractions enriched in AMBRA1–BECLIN 1 upon starvation are indicated in red.
Figure 6.
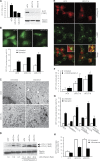
Modulation of autophagy by DLC1 down-regulation. (A) DLC1 down-regulation in GFP-LC3–expressing 2F cells using specific siRNA oligonucleotides (siDLC1a and siDLC1b). DLC1 mRNA and protein levels were analyzed by quantitative PCR (left) and WB (right). siCtr, unrelated oligo; RL, relative levels; tubulin, protein loading control. (B) Increase of basal and starvation-induced autophagy by DLC1 down-regulation. 24 h after transfection with DLC1 siRNA oligonucleotides, GFP-LC3–expressing 2F cells were starved for 4 h or left untreated, and the occurrence of autophagy was analyzed by measuring GFP-LC3 punctate–positive cells. A graph reporting data from three experiments is shown together with representative fluorescence images of siRNA oligonucleotide–transfected cells in control conditions. Bar, 20 µm. (C) Ultrastructural analysis by means of electron microscopy of ultrathin sections from 2F cells transfected with a RNAi oligonucleotides for DLC1 (siDLC1b) or an unrelated oligonucleotide (siCtr) and starved for 4 h or left untreated. Bar, 1.5 µm. (D–F) Increase of autophagosome on rate by DLC1 down-regulation. (D) After DLC1 down-regulation (siDLC1a-b), 2F cells were treated with the lysosome inhibitors E64d and pepstatin A for 4 h or left untreated, and the occurrence of autophagy was analyzed by LC3-I to LC3-II conversion. Densitometric analysis of the band density ratio of LC3-II relative to tubulin is reported with the siCtr ratio arbitrarily defined as 1.00 (
Fig. S4 B
). (E) mCherryLC3-expressing 2F cells transfected as in D and treated with the lysosome inhibitors E64d and pepstatin A for 4 h were stained by using the lysosome marker LAMP1 (green). Insets containing higher magnification views of the merge images are also shown. Bar, 16 µm. Colocalization was assessed by calculating the Pearson’s correlation coefficient r (mean r: siCtr, 0.24 ± 0.02; siDLC1a, 0.66 ± 0.04). (F) GFP-LC3–expressing 2F cells transfected and treated as in D were analyzed for the appearance of GFP-LC3 puncta per cell. *, P < 0.05; **, P < 0.01. (G) Autophagy induced by DLC1 down-regulation requires AMBRA1. GFP-LC3–expressing 2F cells were transfected using DLC1 and AMBRA1 siRNA oligonucleotides (siAMBRA1) either separately or in combination. 24 h after transfection, 2F cells were starved for 4 h or left untreated, and the occurrence of autophagy was analyzed by measuring GFP-LC3 punctate–positive cells. (H) Autophagy induced by DLC1 down-regulation requires PI3K activity. After DLC1 down-regulation, 2F cells were incubated with Wortmannin for 4 h and analyzed for appearance of GFP-LC3 punctate staining. Error bars indicate mean ± SD of three experiments.
Figure 7.
AMBRA1 interaction with DLC1 regulates its proautophagic function. (A and B) AMBRA1 mutants defective for DLC1 interaction have an increased autophagic potential. GFP-LC3–expressing 2F cells were transduced with retroviral vectors encoding AMBRA1 wild-type (AMBRA1 FL) or TAT1 and TAT2 mutants (AMBRA1TAT1 and TAT2) and analyzed for the appearance of GFP-LC3 punctate staining (A) or for AVO formation by FACS measurement of Acridine orange staining (B). Values represent the mean ± SD of three experiments. (C) 2F cells infected with retroviral vectors encoding Myc-tagged FL, TAT1, or TAT2 AMBRA1 proteins were fixed and stained with the anti-Myc (AMBRA1; green) and anti-ERp57 (red) antibodies. AMBRA1-FL–overexpressing cells were analyzed either in control or starvation conditions. (bottom) The images showing the merge of the two fluorescence signals are shown. Colocalization was assessed by calculating the Pearson’s correlation coefficient r of at least 10 cells analyzed in two independent experiments (mean r: AMBRA1 FL untreated, 0.30 ± 0.10; AMBRA1 FL starvation, 0.52 ± 0.12; AMBRA1TAT1 untreated, 0.54 ± 0.04; AMBRA1TAT2 untreated, 0.53 ± 0.01). A βgal retroviral vector was used as a negative control. (D) 2F cells infected with retroviral vectors encoding Myc-tagged βgal, FL AMBRA1, or TAT2 AMBRA1 proteins were fixed and stained with the anti–BECLIN 1 (red) and anti-ERp57 (green) antibodies. (bottom) The images showing the merge of the two fluorescence signals are shown. Colocalization was assessed by calculating the Pearson’s correlation coefficient r (mean r: βgal, 0.37 ± 0.03; AMBRA1 FL, 0.44 ± 0.03; AMBRA1TAT2, 0.54 ± 0.05). Bars, 8 µm.
Figure 8.
Proposed model of AMBRA1 dynamic interaction with the dynein motor complex during autophagy induction. AMBRA1 is bound in a presumably inactive state to the dynein complex via binding to DLC1. After autophagy induction, AMBRA1 is released from the dynein complex upon ULK1-dependent phosphorylation and translocates to the ER together with BECLIN 1–VPS34 to allow autophagosome formation. The dynein motor complex consists of a Head domain (dynein heavy chain) and a Base domain (DIC, DLC1, or DLC2 and other factors such as TCTEX1 and ROADBLOCK1).
Similar articles
- Unleashing the Ambra1-Beclin 1 complex from dynein chains: Ulk1 sets Ambra1 free to induce autophagy.
Fimia GM, Di Bartolomeo S, Piacentini M, Cecconi F. Fimia GM, et al. Autophagy. 2011 Jan;7(1):115-7. doi: 10.4161/auto.7.1.14071. Epub 2011 Jan 1. Autophagy. 2011. PMID: 21079415 - Cul3-KLHL20 Ubiquitin Ligase Governs the Turnover of ULK1 and VPS34 Complexes to Control Autophagy Termination.
Liu CC, Lin YC, Chen YH, Chen CM, Pang LY, Chen HA, Wu PR, Lin MY, Jiang ST, Tsai TF, Chen RH. Liu CC, et al. Mol Cell. 2016 Jan 7;61(1):84-97. doi: 10.1016/j.molcel.2015.11.001. Epub 2015 Dec 10. Mol Cell. 2016. PMID: 26687681 - mTOR inhibits autophagy by controlling ULK1 ubiquitylation, self-association and function through AMBRA1 and TRAF6.
Nazio F, Strappazzon F, Antonioli M, Bielli P, Cianfanelli V, Bordi M, Gretzmeier C, Dengjel J, Piacentini M, Fimia GM, Cecconi F. Nazio F, et al. Nat Cell Biol. 2013 Apr;15(4):406-16. doi: 10.1038/ncb2708. Epub 2013 Mar 24. Nat Cell Biol. 2013. PMID: 23524951 - Impaired autophagy and APP processing in Alzheimer's disease: The potential role of Beclin 1 interactome.
Salminen A, Kaarniranta K, Kauppinen A, Ojala J, Haapasalo A, Soininen H, Hiltunen M. Salminen A, et al. Prog Neurobiol. 2013 Jul-Aug;106-107:33-54. doi: 10.1016/j.pneurobio.2013.06.002. Epub 2013 Jul 1. Prog Neurobiol. 2013. PMID: 23827971 Review. - Ambra1 at a glance.
Cianfanelli V, De Zio D, Di Bartolomeo S, Nazio F, Strappazzon F, Cecconi F. Cianfanelli V, et al. J Cell Sci. 2015 Jun 1;128(11):2003-8. doi: 10.1242/jcs.168153. J Cell Sci. 2015. PMID: 26034061 Review.
Cited by
- Bcl-2:Beclin 1 complex: multiple, mechanisms regulating autophagy/apoptosis toggle switch.
Marquez RT, Xu L. Marquez RT, et al. Am J Cancer Res. 2012;2(2):214-21. Epub 2012 Feb 15. Am J Cancer Res. 2012. PMID: 22485198 Free PMC article. - Disruption of Endoplasmic Reticulum and ROS Production in Human Ovarian Cancer by Campesterol.
Bae H, Park S, Yang C, Song G, Lim W. Bae H, et al. Antioxidants (Basel). 2021 Mar 3;10(3):379. doi: 10.3390/antiox10030379. Antioxidants (Basel). 2021. PMID: 33802602 Free PMC article. - Cellular adaptation to nutrient deprivation: crosstalk between the mTORC1 and eIF2α signaling pathways and implications for autophagy.
Wengrod JC, Gardner LB. Wengrod JC, et al. Cell Cycle. 2015;14(16):2571-7. doi: 10.1080/15384101.2015.1056947. Cell Cycle. 2015. PMID: 26039820 Free PMC article. - AMBRA1 and its role as a target for anticancer therapy.
Li X, Lyu Y, Li J, Wang X. Li X, et al. Front Oncol. 2022 Sep 27;12:946086. doi: 10.3389/fonc.2022.946086. eCollection 2022. Front Oncol. 2022. PMID: 36237336 Free PMC article. Review. - Drosophila Fip200 is an essential regulator of autophagy that attenuates both growth and aging.
Kim M, Park HL, Park HW, Ro SH, Nam SG, Reed JM, Guan JL, Lee JH. Kim M, et al. Autophagy. 2013 Aug;9(8):1201-13. doi: 10.4161/auto.24811. Epub 2013 May 14. Autophagy. 2013. PMID: 23819996 Free PMC article.
References
- Axe E.L., Walker S.A., Manifava M., Chandra P., Roderick H.L., Habermann A., Griffiths G., Ktistakis N.T. 2008. Autophagosome formation from membrane compartments enriched in phosphatidylinositol 3-phosphate and dynamically connected to the endoplasmic reticulum. J. Cell Biol. 182:685–701 10.1083/jcb.200803137 - DOI - PMC - PubMed
- Campbell K.S., Cooper S., Dessing M., Yates S., Buder A. 1998. Interaction of p59fyn kinase with the dynein light chain, Tctex-1, and colocalization during cytokinesis. J. Immunol. 161:1728–1737 - PubMed
Publication types
MeSH terms
Substances
LinkOut - more resources
Full Text Sources
Other Literature Sources
Molecular Biology Databases
Research Materials
