STAT6-mediated displacement of polycomb by trithorax complex establishes long-term maintenance of GATA3 expression in T helper type 2 cells - PubMed (original) (raw)
STAT6-mediated displacement of polycomb by trithorax complex establishes long-term maintenance of GATA3 expression in T helper type 2 cells
Atsushi Onodera et al. J Exp Med. 2010.
Abstract
Polycomb group (PcG) and trithorax group (TrxG) complexes exert opposing effects on the maintenance of the transcriptional status of the developmentally regulated Hox genes. In this study, we show that activation of STAT6 induces displacement of the PcG complex by the TrxG complex at the upstream region of the gene encoding GATA3, a transcription factor essential for T helper type 2 (Th2) cell differentiation. Once Th2 cells differentiate, TrxG complex associated with the TrxG component Menin binds to the whole GATA3 gene locus, and this binding is required for the long-term maintenance of expression of GATA3 and Th2 cytokine. Thus, STAT6-mediated displacement of PcG by the TrxG complex establishes subsequent STAT6-independent maintenance of GATA3 expression in Th2 cells via the recruitment of the Menin-TrxG complex.
Figures
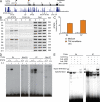
Figure 1.
Changes in the histone modifications and PcG and TrxG binding to the GATA3 locus during Th2 cell differentiation. (A) GATA3 mRNA was measured by quantitative RT-PCR (left panel shows the relative intensity, compared with HPRT; the mean ± SD of three samples). GATA3 protein expression was determined by intracellular staining (right). Splenic B cells, naive CD4 T cells, effector Th2 cells (Th2), and fully developed Th2 cells (Full dev Th2) were used. Two independent experiments were performed with similar results. (B) Schematic representation of the mouse GATA3 gene locus. Open rectangles indicate a noncoding exon, and closed rectangles indicate a coding exon. Closed triangles show the locations of PCR primer pairs used in the ChIP assay. Positions of TaqMan probes used for real-time quantitative PCR ChIP are indicated in relative kilobases to the GATA3 translational start site. (C) A representative result of a ChIP assay using antibodies specific for the indicated proteins, with a series of primer pairs covering the GATA3 locus. PCR product band intensities relative to input in each primer pair are shown. PCR product bands are shown in
Fig. S1
. Five independent experiments were performed with similar results. (D) Binding of the PcG complex molecule, Bmi1, EZH2, and Suz12, modifications of histone H3-K27, and total histone H3 levels at several regions around the GATA3 gene locus were determined by ChIP assays with quantitative PCR analysis (left). Binding of the Menin–TrxG complex and RNAPII and the status of H3-K4Me3 and H3-K9Ac were also determined by quantitative ChIP assays (right). The relative intensity ([specific antibody ChIP − control Ig ChIP]/input DNA; highest signal intensity = 10; mean of three samples) is shown with SDs. Three independent experiments were performed with similar results.
Figure 2.
The displacement of the PcG by the TrxG complex at the GATA3 gene locus was induced in a STAT6-dependent manner. (A and B) GATA3 expression in STAT6-deficient naive CD4 T cells and Th2 cells was determined by a quantitative PCR. The relative intensity compared with HPRT (mean of three samples with SD) is shown. (C) The levels of GATA3 protein expression were determined by intracellular staining. (D) PcG and TrxG binding to the GATA3 locus and histone modifications in STAT6-deficient naive CD4 T cells and Th2 cells were determined by a ChIP assay with a quantitative PCR analysis as described in Fig. 1 D. Positions of TaqMan probes described in Fig. 1 B are indicated in the parenthesis. The total H3 levels were included as a control. (E) PcG and TrxG binding to the GATA3 gene locus and histone modifications in Th1, Th2, and STAT6-deficient Th2 cells were determined by a ChIP assay. Positions of TaqMan probes described in Fig. 1 B are indicated. (D and E) The relative intensity (mean of three samples) is shown with SDs. (A–E) Three independent experiments were performed with similar results.
Figure 3.
Identification of the binding site of STAT6 at the GATA3 gene locus. (A) Schematic illustration of the GATA3 gene locus. 11 putative STAT-binding sites designated as S1–S11 (black dots) are indicated. The blue panel shows the conservation track obtained from the University of California, Santa Cruz Genome Browser. (B) CD4 T cells were stimulated with 100 U/ml IL-4 and immobilized anti-TCR mAb for the indicated periods. The stimulated cells were cross-linked with paraformaldehyde and then sonicated. The lysates were subjected to a ChIP assay with anti-STAT6 mAb or control Ig. The results are representative of three independent experiments. (C) CD4 T cells stimulated in medium or under Th2 cell culture conditions for 1 h were subjected to a ChIP assay. The levels of STAT6 binding at the S4 and S7 sites were determined by a quantitative PCR analysis. Three independent experiments were performed with similar results. The relative intensity (mean of three samples) is shown with SDs. (D) EMSA was performed using radiolabeled double-strand probes containing S4, Mut-S4, S7, or Mut-S7 and nuclear extracts from IL-4–stimulated WT or STAT6-deficient Th2 cells. Results are representative of two independent experiments. (E) EMSA with nuclear extracts from WT Th2 cells and radiolabeled S4 or S7 probes. Antibodies against p300, CBP, STAT6, or control mouse Ig were added to the reaction to supershift the STAT6–DNA complex. The results are representative of two independent experiments.
Figure 4.
TSA treatment induced dissociation of PcG complex at the upstream region of the GATA3 gene locus. Freshly prepared WT or STAT6-deficient CD4 T cells were stimulated under Th2 culture conditions, and where indicated, 10 ng/ml TSA was added on day 2. 3 d later, the cells were subjected to ChIP assays using the indicated antibodies. (A) Effects of TSA treatment on the dissociation of Bmi1 and EZH2 and the status of H3-K27Me3. The total H3 levels were included as a control. (B) Effects of TSA treatment on the recruitment of TrxG complexes (MLL and Menin) and the status of H3-K4Me3 and H3-K9Ac. (A and B) The relative intensity (mean of three samples) is shown with SDs. (C) The levels of noncoding transcripts at the GATA3 gene locus and mature GATA3 mRNA and HPRT in cells stimulated as in A and B were determined by quantitative RT-PCR. The relative intensity compared with HPRT (mean of three samples with SDs) is shown. Effect of TSA treatment on the recruitment of Ser5-P and Ser2-P RNAPII was determined by a ChIP assay with quantitative PCR (bottom). (A–C) Positions of TaqMan probes described in Fig. 1 B are indicated in the parenthesis. Three independent experiments were performed with similar results.
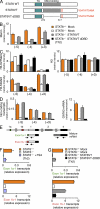
Figure 5.
STAT6 activation was necessary and sufficient for recruitment of Menin and up-regulation of mature GATA3 mRNA during Th2 cell differentiation. (A) Schematic representation of STAT6 WT, full-length STAT6VT, and DNA-binding mutant (dDBD) with location of the transactivation (TA) and DNA-binding domain indicated. STAT6VT and STAT6VT dDBD contain V547A and T548A mutations. (B–D) Freshly isolated WT or STAT6-deficient CD4 T cells were stimulated under Th2 conditions for 2 d, and then the cells were mock infected or infected with a retrovirus vector containing a STAT6VT cDNA (pMXs-STAT6VT-IRES-hNGFR) or a STAT6VT dDBD cDNA (pMXs-STAT6VT-dDBD-IRES-hNGFR). hNGFR-positive infected cells were enriched by magnetic cell sorting. (B) The levels of Menin binding to the GATA3 gene locus were assessed by a ChIP assay. (C) Effect of STAT6VT introduction on the histone modifications was determined by a ChIP assay with quantitative PCR. (B and C) The relative intensity (mean of three samples) is shown with SDs. (D) Noncoding transcripts and mature GATA3 mRNA were measured by quantitative PCR. (E) Schematic illustration of the GATA3 exon 1a, exon 1b, and exon 1 and the primer sites for the amplification of the 1a (exon 1a-1)- and 1b-containing transcript (exon 1b-1). Arrows represent the position of primer pairs for PCR detection. Squiggly lines represent the break in a long section of the gene. (F and G) The levels of GATA3 exon 1a–containing transcript and exon 1b–containing transcript were measured by exon-specific quantitative PCR analysis. (F) TSA treatment was performed as described in Fig 4. (D, F, and G) The relative expression (mean of three samples) is shown with SDs. (B–D, F, and G) Two independent experiments were performed with similar results.
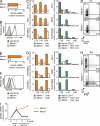
Figure 6.
Menin-deficient effector Th2 cells failed to maintain the expression of GATA3 in the absence of IL-4. (A–D) Naive CD4 T cells from WT or Menin-deficient mice were cultured under Th2 conditions for 5 d (first cycle). These Th2 cells were further cultured for 2 d in the absence of cytokines and then restimulated with anti-TCR mAb in the presence of IL-2 and anti–IL-4 mAb for an additional 5 d (second cycle). (E–H) This cycle was repeated again (third cycle). (A and E) GATA3 mRNA was determined by quantitative RT-PCR. The relative intensity compared with HPRT (mean of three samples with the SDs) is shown. (B and F) GATA3 protein expression was determined by intracellular staining. (C and G) Histone modifications and PcG and TrxG binding to the GATA3 locus were determined by ChIP assays with quantitative PCR analysis as described in Fig. 1 D. The relative intensity (mean of three samples) is shown with SDs. (D and H) The cultured cells were restimulated with immobilized anti-TCR mAb and monensin for 6 h, and intracellular IFN-γ and IL-4 staining profiles were examined. Representative profiles are shown with the percentages of cells in each area. (I) A time course analysis of GATA3 mRNA expression in WT and Menin-deficient naive CD4 T cells (0 cycle), in vitro differentiated Th2 cells (first cycle), and Th2 cells cultured in the presence of anti–IL-4 (second and third cycles). The relative expression (mean of three samples) is shown with SDs. (A–I) Three independent experiments were performed with similar results.
Figure 7.
Schematic illustration of the transcriptional regulation of the GATA3 gene in naive CD4 T cells, developing Th2 cells, and developed Th2 cells. In naive CD4 T cells, the PcG complex binds to the upstream region of the proximal promoter of the GATA3 gene, and the expression of GATA3 mRNA is moderate. After stimulation through TCR in the presence of IL-4 (Th2 culture conditions), STAT6 is activated, and STAT6 associated with the HAT complex binds to the GATA3 gene locus. HAT-dependent histone acetylation spreads to the upstream region, resulting in the dissociation of PcG complex. A high-level GATA3 mRNA expression is achieved in an IL-4/STAT6-dependent but Menin–TrxG-independent manner. The role of Menin–TrxG recruitment in GATA3 transcription appears to be minimal at this stage. Once Th2 cells are developed, the Menin–TrxG complex binds to the whole GATA3 gene region, including the upstream region of the proximal promoter. A broad range of H3-K9Ac and H3-K4Me3 is observed. The Menin–TrxG complex bound to the GATA3 locus maintains the high expression levels of GATA3 in the absence of IL-4. IL-4/STA6-independent but Menin–TrxG-dependent regulation of the transcription of GATA3 is operating.
Similar articles
- Critical role of the Polycomb and Trithorax complexes in the maintenance of CD4 T cell memory.
Nakayama T, Yamashita M. Nakayama T, et al. Semin Immunol. 2009 Apr;21(2):78-83. doi: 10.1016/j.smim.2009.02.001. Epub 2009 Mar 9. Semin Immunol. 2009. PMID: 19269851 Review. - Menin Controls the Memory Th2 Cell Function by Maintaining the Epigenetic Integrity of Th2 Cells.
Onodera A, Kiuchi M, Kokubo K, Kato M, Ogino T, Horiuchi S, Kanai U, Hirahara K, Nakayama T. Onodera A, et al. J Immunol. 2017 Aug 1;199(3):1153-1162. doi: 10.4049/jimmunol.1602129. Epub 2017 Jun 28. J Immunol. 2017. PMID: 28659357 - Regulation of Th2 cell development by Polycomb group gene bmi-1 through the stabilization of GATA3.
Hosokawa H, Kimura MY, Shinnakasu R, Suzuki A, Miki T, Koseki H, van Lohuizen M, Yamashita M, Nakayama T. Hosokawa H, et al. J Immunol. 2006 Dec 1;177(11):7656-64. doi: 10.4049/jimmunol.177.11.7656. J Immunol. 2006. PMID: 17114435 - Trithorax complex component Menin controls differentiation and maintenance of T helper 17 cells.
Watanabe Y, Onodera A, Kanai U, Ichikawa T, Obata-Ninomiya K, Wada T, Kiuchi M, Iwamura C, Tumes DJ, Shinoda K, Yagi R, Motohashi S, Hirahara K, Nakayama T. Watanabe Y, et al. Proc Natl Acad Sci U S A. 2014 Sep 2;111(35):12829-34. doi: 10.1073/pnas.1321245111. Epub 2014 Aug 18. Proc Natl Acad Sci U S A. 2014. PMID: 25136117 Free PMC article. - Polycomb group and trithorax group proteins in Arabidopsis.
Pien S, Grossniklaus U. Pien S, et al. Biochim Biophys Acta. 2007 May-Jun;1769(5-6):375-82. doi: 10.1016/j.bbaexp.2007.01.010. Epub 2007 Feb 7. Biochim Biophys Acta. 2007. PMID: 17363079 Review.
Cited by
- Polycomb antagonizes p300/CREB-binding protein-associated factor to silence FOXP3 in a Kruppel-like factor-dependent manner.
Xiong Y, Khanna S, Grzenda AL, Sarmento OF, Svingen PA, Lomberk GA, Urrutia RA, Faubion WA Jr. Xiong Y, et al. J Biol Chem. 2012 Oct 5;287(41):34372-85. doi: 10.1074/jbc.M111.325332. Epub 2012 Aug 15. J Biol Chem. 2012. PMID: 22896699 Free PMC article. - New Insights into Epigenetic Regulation of T Cell Differentiation.
Dutta A, Venkataganesh H, Love PE. Dutta A, et al. Cells. 2021 Dec 8;10(12):3459. doi: 10.3390/cells10123459. Cells. 2021. PMID: 34943965 Free PMC article. Review. - Transcriptional regulation by STAT6.
Goenka S, Kaplan MH. Goenka S, et al. Immunol Res. 2011 May;50(1):87-96. doi: 10.1007/s12026-011-8205-2. Immunol Res. 2011. PMID: 21442426 Free PMC article. Review. - A Box of Chemistry to Inhibit the MEN1 Tumor Suppressor Gene Promoting Leukemia.
Ozyerli-Goknar E, Nizamuddin S, Timmers HTM. Ozyerli-Goknar E, et al. ChemMedChem. 2021 May 6;16(9):1391-1402. doi: 10.1002/cmdc.202000972. Epub 2021 Mar 10. ChemMedChem. 2021. PMID: 33534953 Free PMC article. Review. - Long non-coding RNA nuclear paraspeckle assembly transcript 1 promotes activation of T helper 2 cells via inhibiting STAT6 ubiquitination.
Huang S, Dong D, Zhang Y, Chen Z, Geng J, Zhao Y. Huang S, et al. Hum Cell. 2021 May;34(3):800-807. doi: 10.1007/s13577-021-00496-1. Epub 2021 Feb 7. Hum Cell. 2021. PMID: 33550532
References
- Asnagli H., Afkarian M., Murphy K.M. 2002. Cutting edge: Identification of an alternative GATA-3 promoter directing tissue-specific gene expression in mouse and human. J. Immunol. 168:4268–4271 - PubMed
Publication types
MeSH terms
Substances
LinkOut - more resources
Full Text Sources
Molecular Biology Databases
Research Materials
Miscellaneous


